We've spent years building Cube Store around a particular workload: serving queries over pre-aggregated data. Cube Store has served billions of queries in production. The engineering behind that involves more than making a large table smaller. Once the data is prepared, it still needs to be organized, kept available, and queried efficiently as requests arrive.
Pre-aggregations are a familiar way to avoid repeating expensive joins and calculations. Aggregate awareness lets a system recognize which prepared data can correctly answer a new question. In Query Latency in the Age of AI Agents, we explored why both matter as agents generate more analytical queries.
Here, I want to focus on the engine that serves those aggregates. Its design affects every internal dashboard, embedded analytics interaction, and agent investigation that reads prepared data through Cube.
Aggregate Awareness
A daily rollup of revenue by region can answer several questions: daily revenue, monthly revenue, or revenue for a particular region. The query changes, but the stored daily sums remain useful. Aggregate awareness is the ability to recognize that reuse and rewrite the query without changing its meaning.
Cube's semantic layer checks the measures, dimensions, filters, and time granularity needed by a query against available pre-aggregations. A rollup containing revenue totals can't answer a request for individual transaction IDs. If there is no eligible match, Cube normally queries the source.
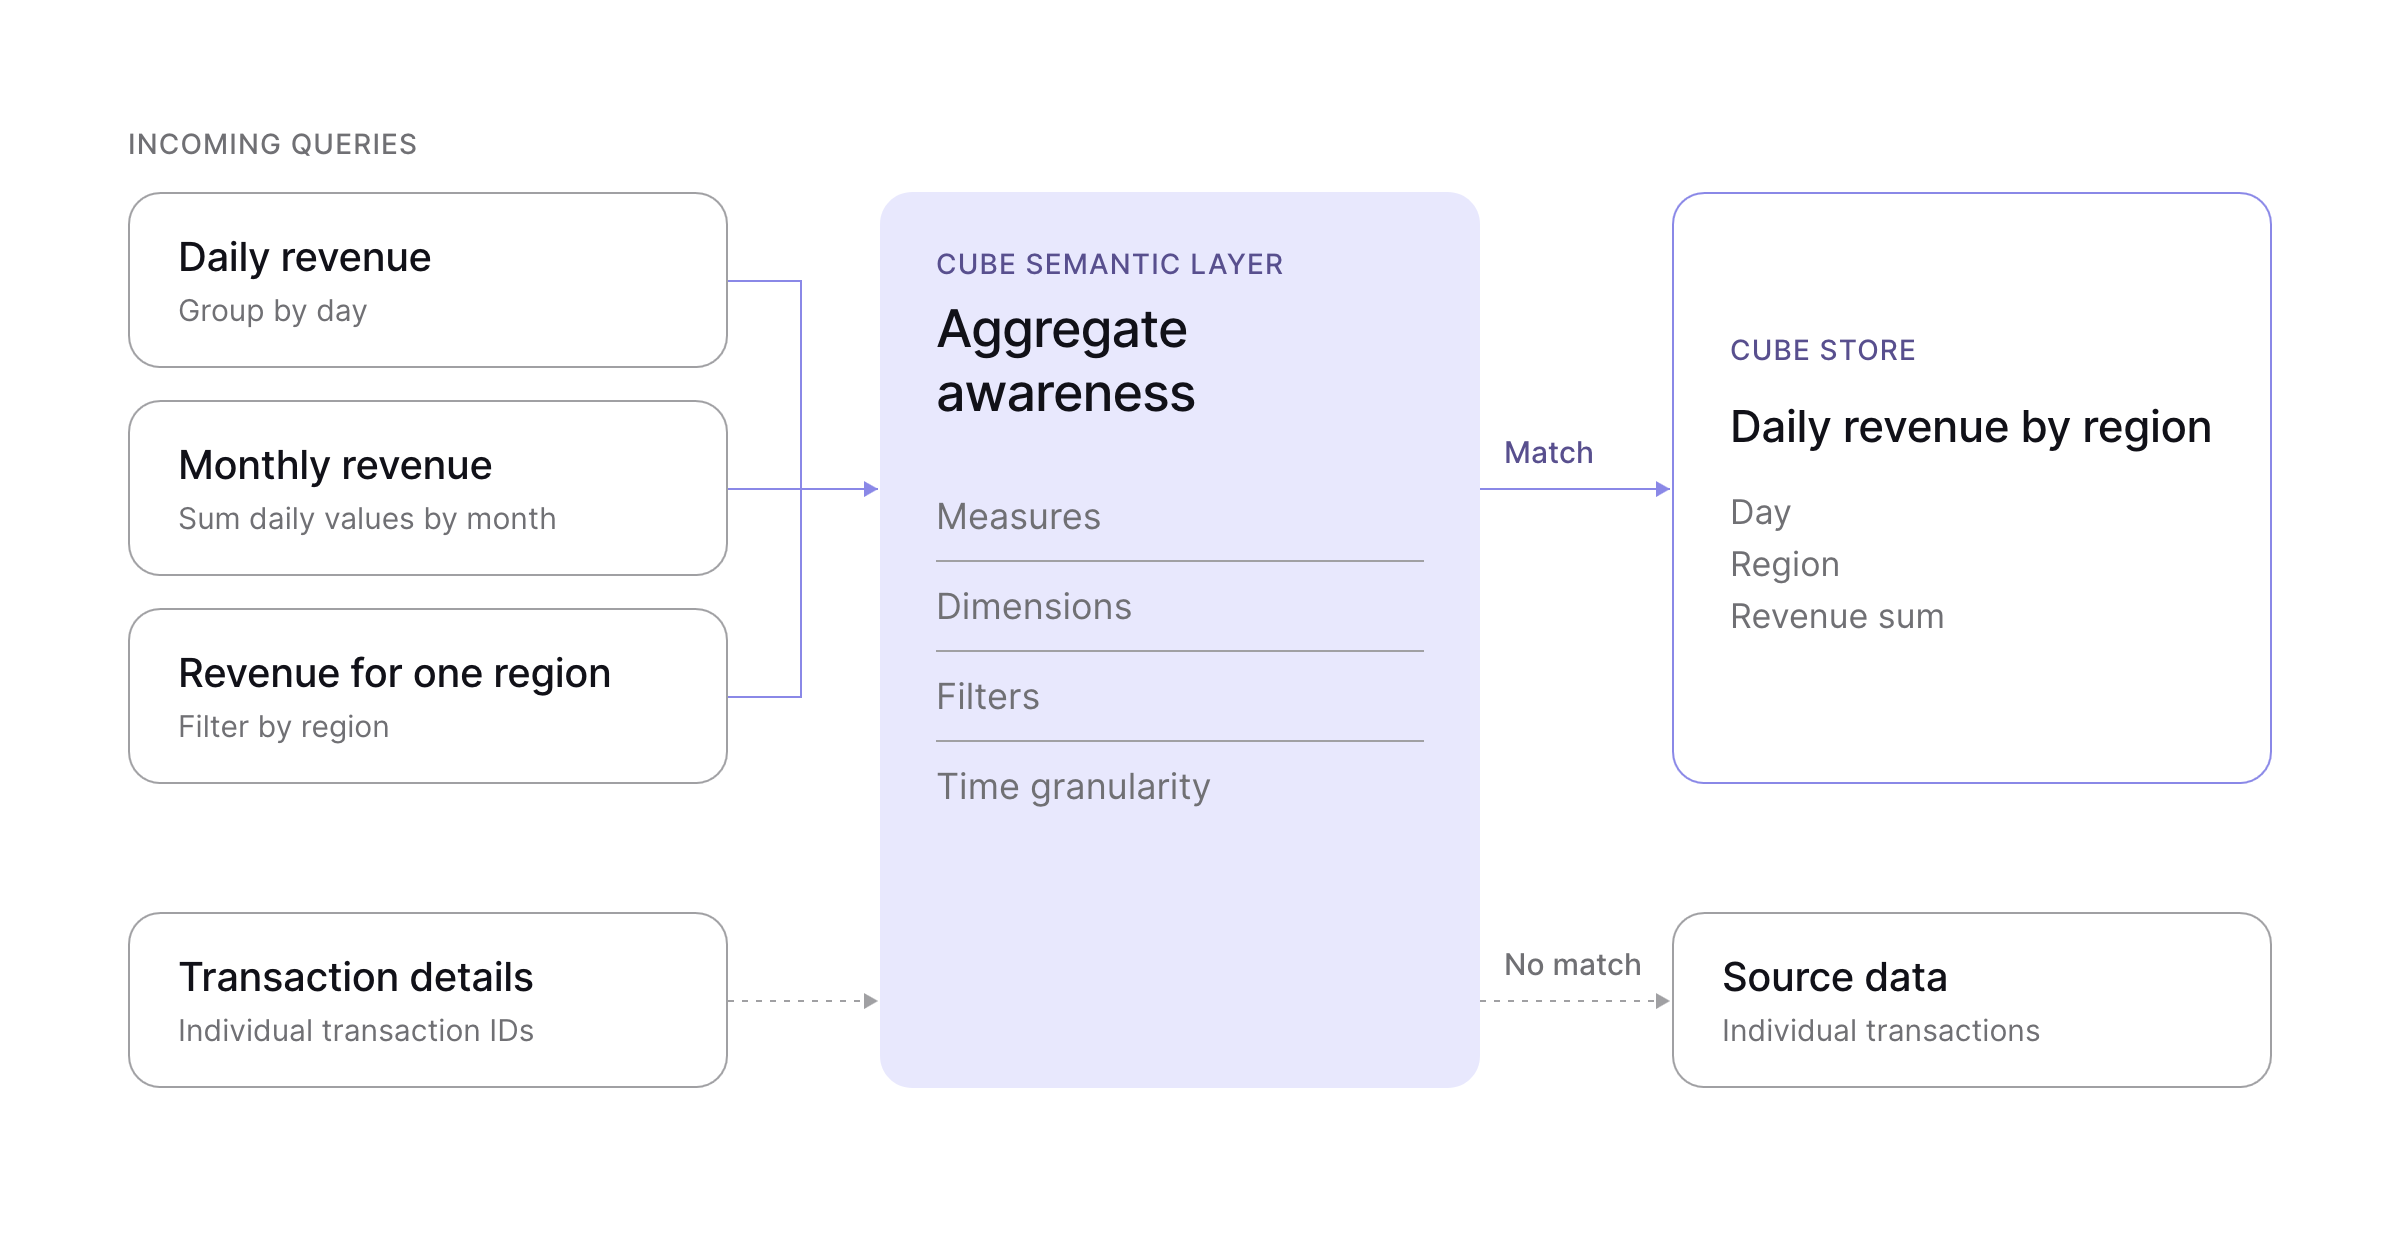
This gives the serving engine a workload we can prepare for. The model defines the calculations and the detail we retain; recurring queries tell us which filters and groupings deserve efficient access paths. An agent can ask a new question within that coverage without needing a separately cached answer for every variation.
The Serving Workload
Small data isn't automatically simple. Even a compact table with many dimensions permits many combinations of filters and groupings. Choosing measures, dimensions, and grain for a modeled workload gives us a set of query families to optimize. Their size alone doesn't make queries predictable.
The distinction also isn't absolute. Some aggregates contain a few hundred rows; others preserve customer, product, or time detail and contain millions. The amount of data a query actually touches depends on its filters and the physical organization of the table.
For a frequent, short query, planning, coordination, and waiting for resources can account for a meaningful part of the response. Under load, an efficient read also leaves more capacity for other requests. We therefore care about the data read per query, the work shared across queries, and what happens when many requests arrive together.
Cube Store Architecture
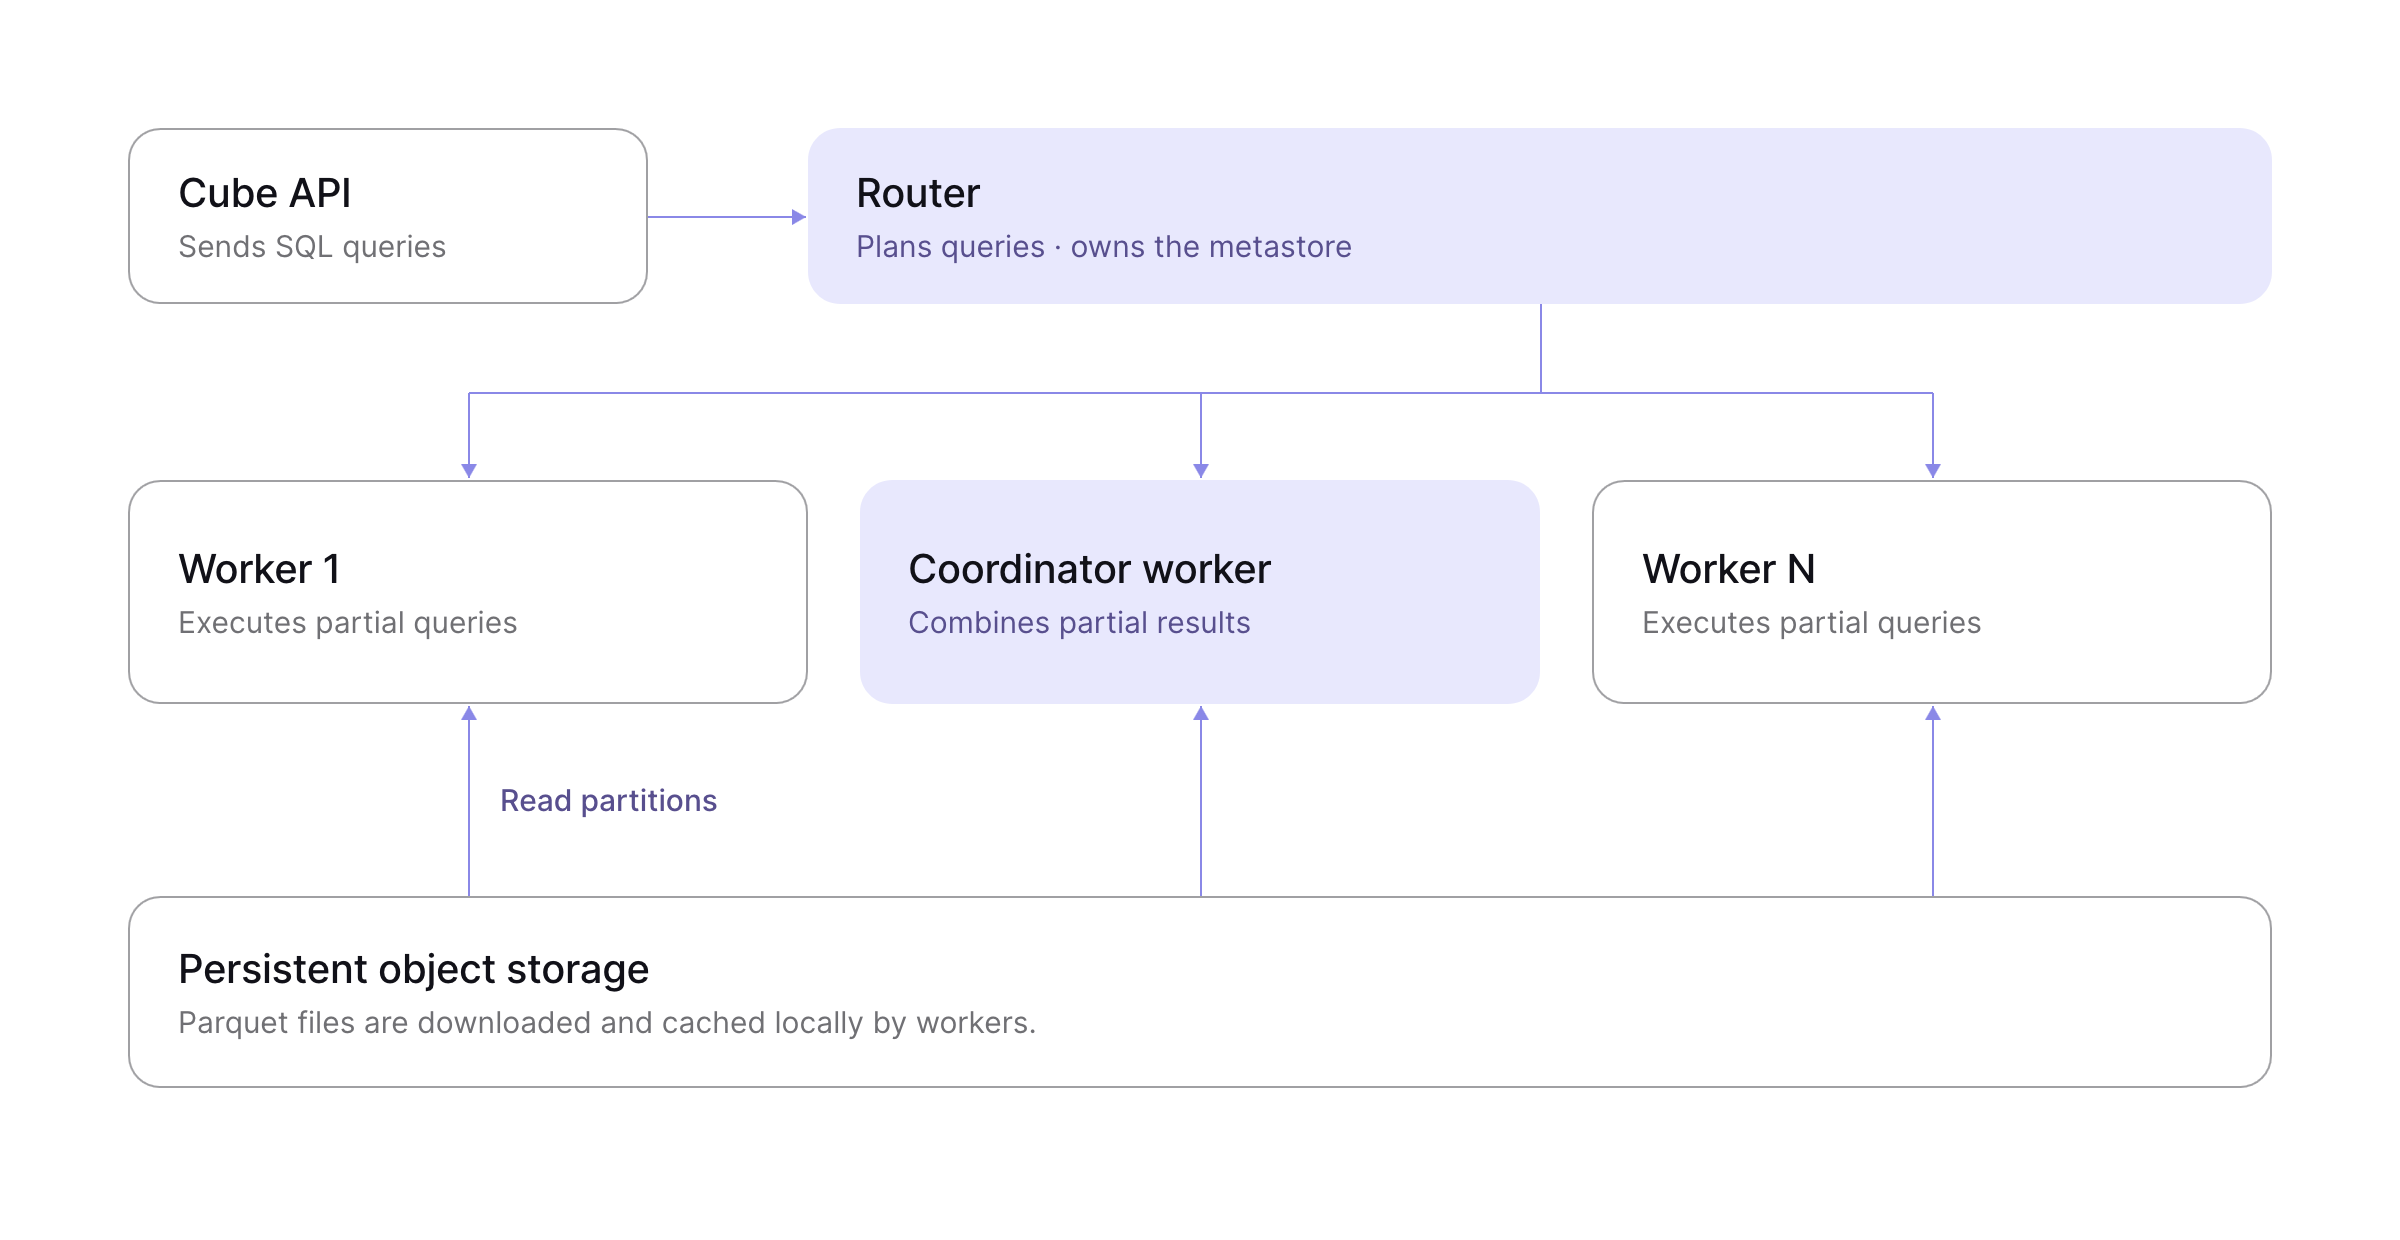
We introduced Cube Store in 2021 to give pre-aggregations their own serving engine. It's a distributed columnar engine written in Rust, using Apache Arrow and DataFusion for execution, Parquet for persistent data, and RocksDB for metadata.
The router maintains metadata and plans queries. It delegates execution to workers, with one worker acting as the query's coordinator. Workers filter and compute partial results; the coordinator combines them. The router's metadata role stays separate from that final data processing.
Sorted Indexes
One of its most useful design choices is to keep indexes as sorted copies of the data. Suppose an embedded usage report repeatedly filters to one account and groups by service. An index ordered by account and service places the relevant rows together. It can also make groups arrive in an order the engine can aggregate incrementally.
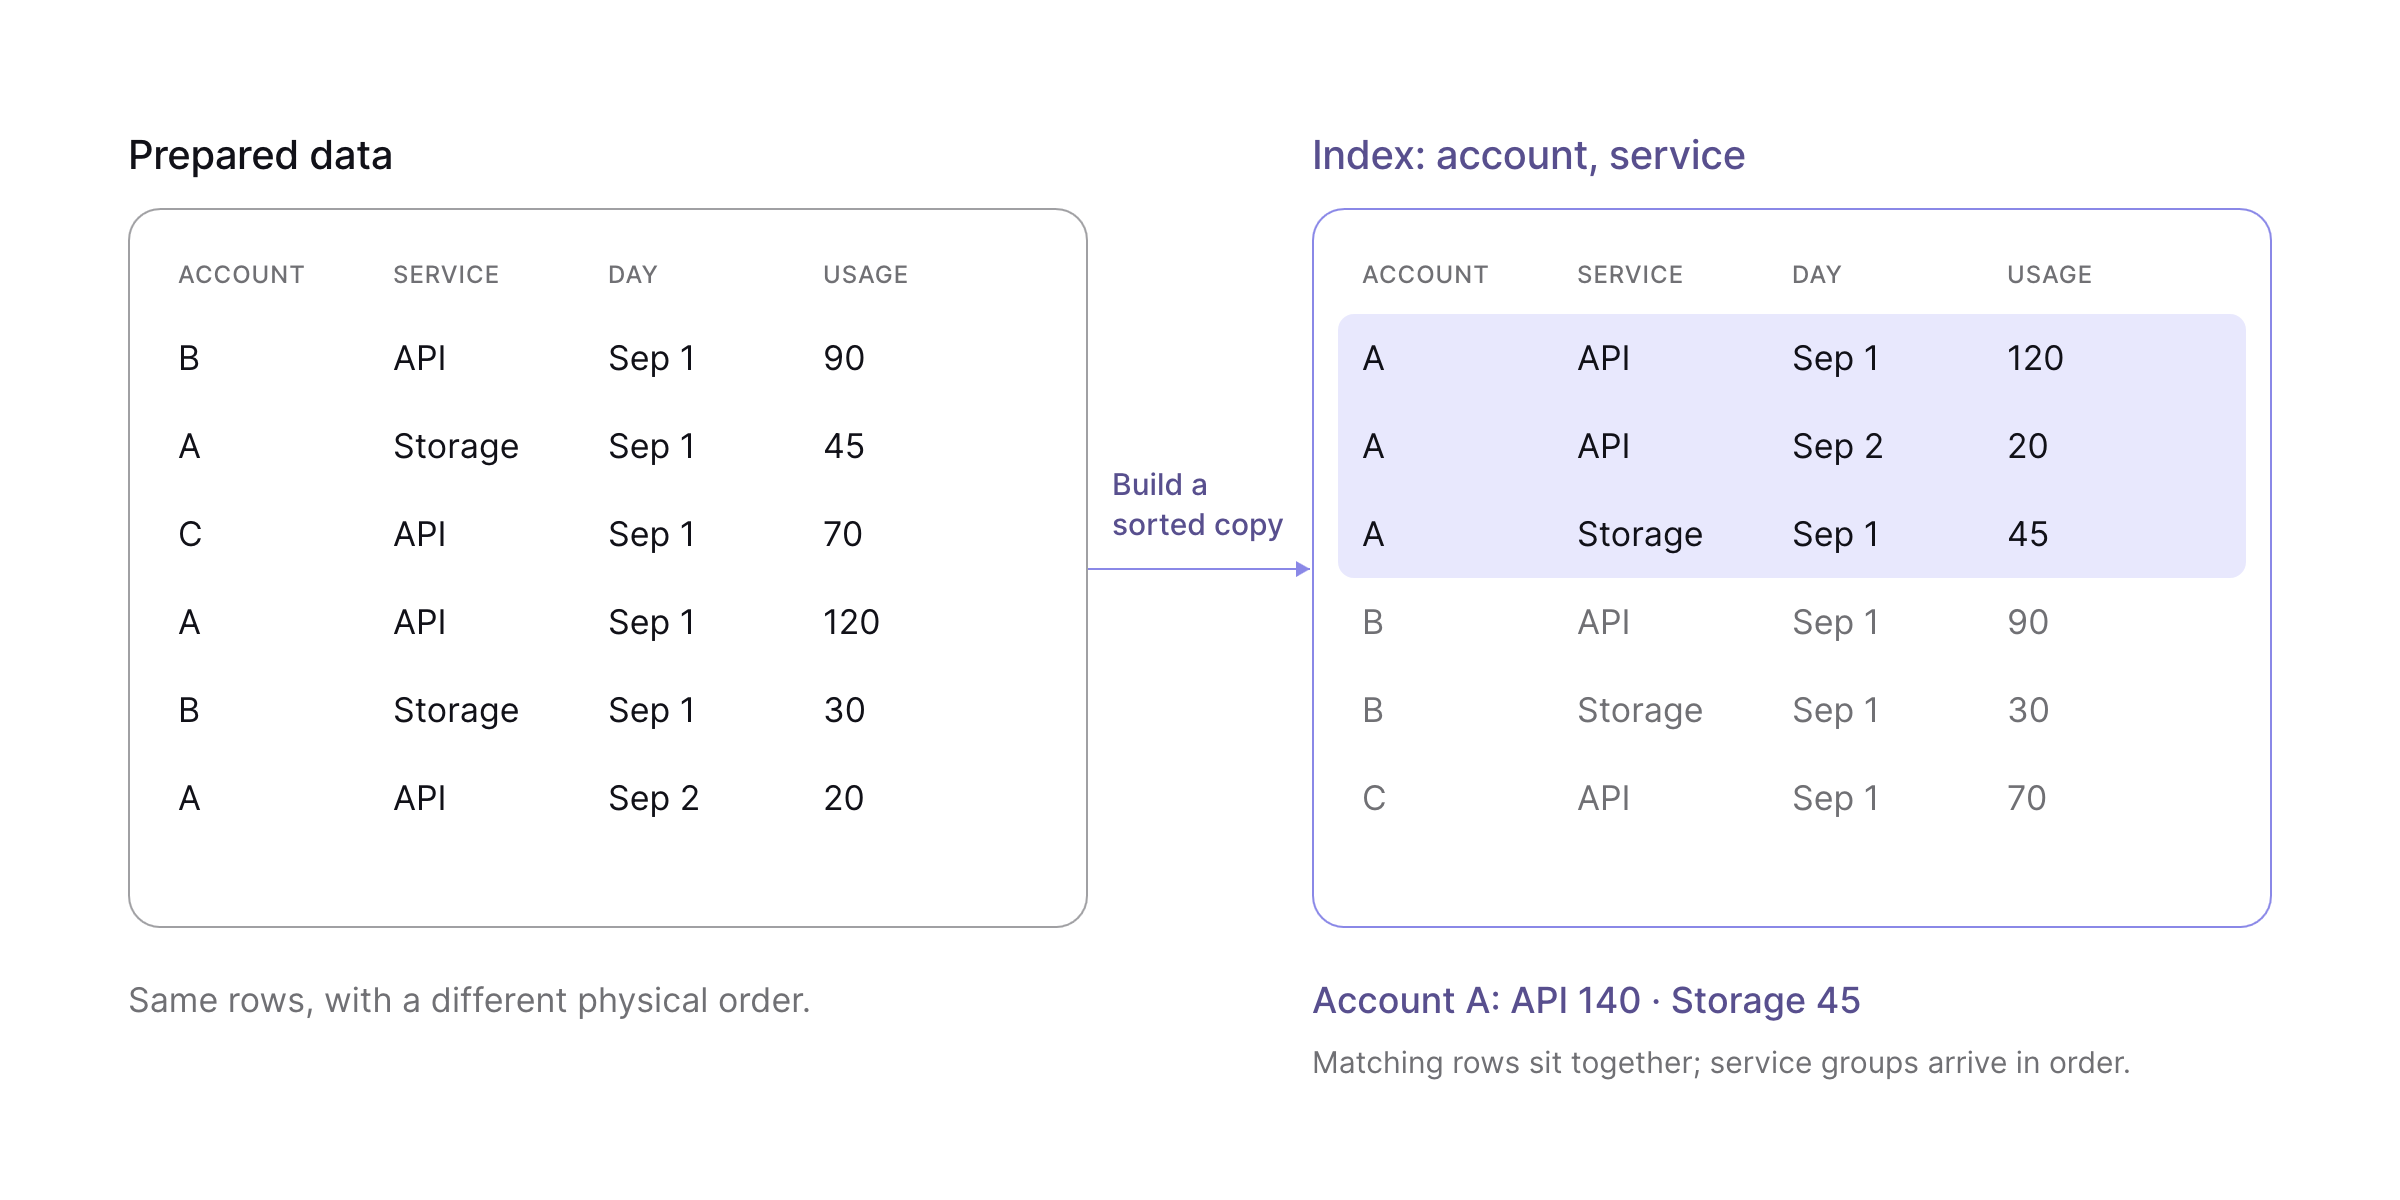
Sorting helps compression because neighboring values often repeat. It also gives filters a physical advantage: ranges of data that cannot match can be skipped. The appropriate order depends on the workload; a different filter or grouping may need another index.
There is a cost. Each additional index consumes storage and adds ingestion work. For a tiny rollup, scanning everything may already be cheap. As the prepared data grows, choosing indexes that match actual query patterns becomes more consequential. We can spend that preparation work once and reuse the organization across many reads.
Pruning and Local Data
Cube Store divides sorted data into partitions. The planner uses value ranges to exclude partitions that can't satisfy a filter; Parquet statistics allow further skipping within files. A large pre-aggregation can therefore support a selective query without reading the whole table.
Persistent files live in object storage, while workers keep local copies of their assigned data. Partition warmup downloads those files before a table comes online. This makes preparing data for service an explicit step, including making it locally available to the workers that will execute queries.
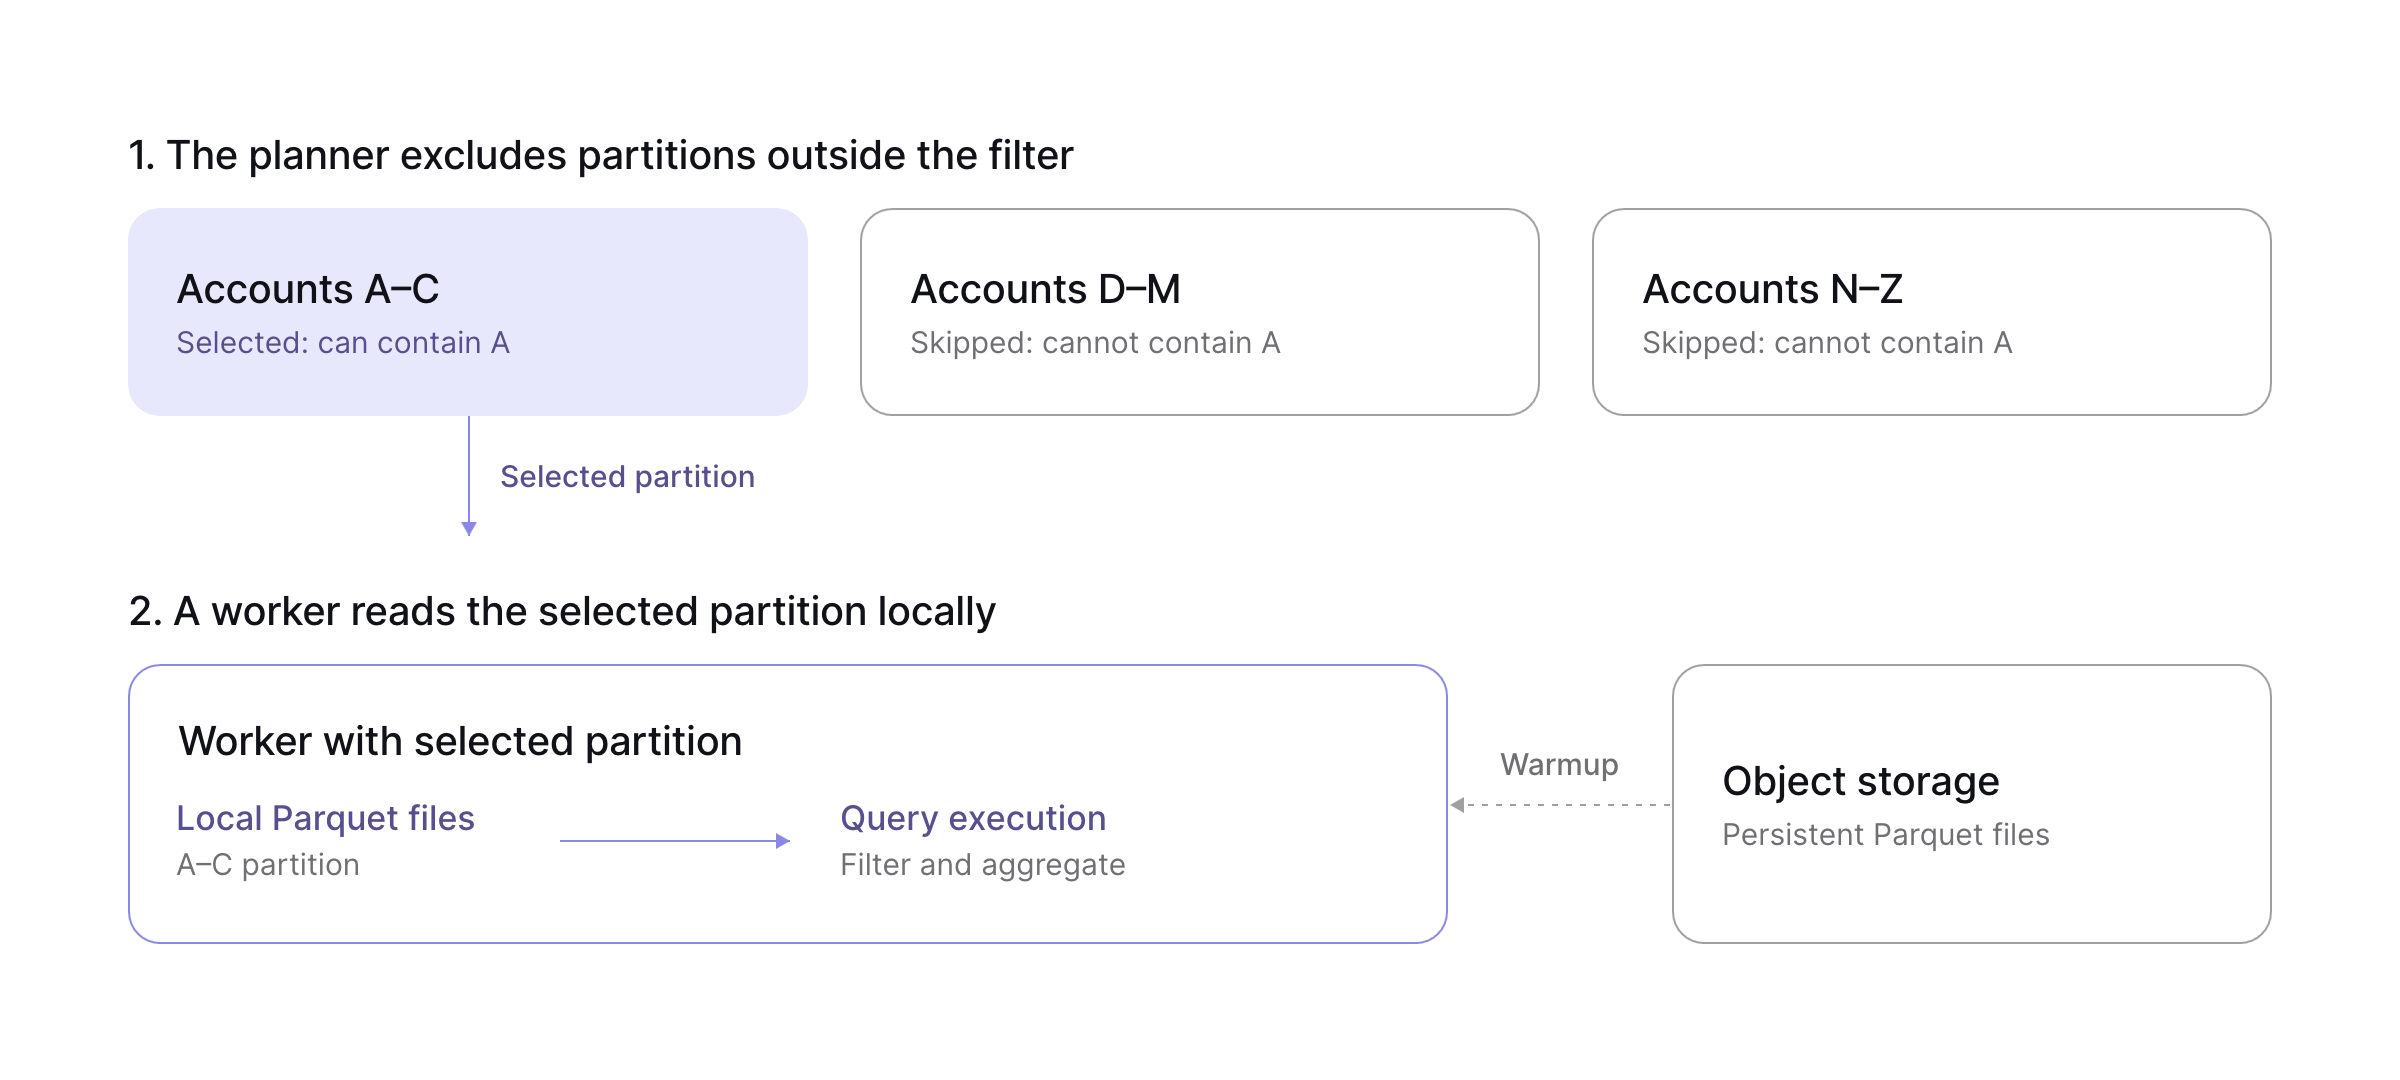
Storage and compute remain separate. Workers can be replaced and recover their data from object storage. That recovery still takes work, so warmup and capacity planning belong in the design alongside steady-state query latency.
Execution and Refresh
Partial aggregation near the data can reduce how much intermediate data moves through the system. When index order matches the grouping, streaming aggregation can also reduce the state the engine needs to maintain. These details matter when multiple queries compete for memory and execution time. The architecture documentation describes the planning and execution stages in more detail.
Prepared data also needs to stay current. A dedicated refresh worker schedules builds and updates. Time partitioning and incremental refresh can limit the work to the periods that change. Building, sorting, and compacting data still consume resources; production tuning needs to consider them alongside reads.
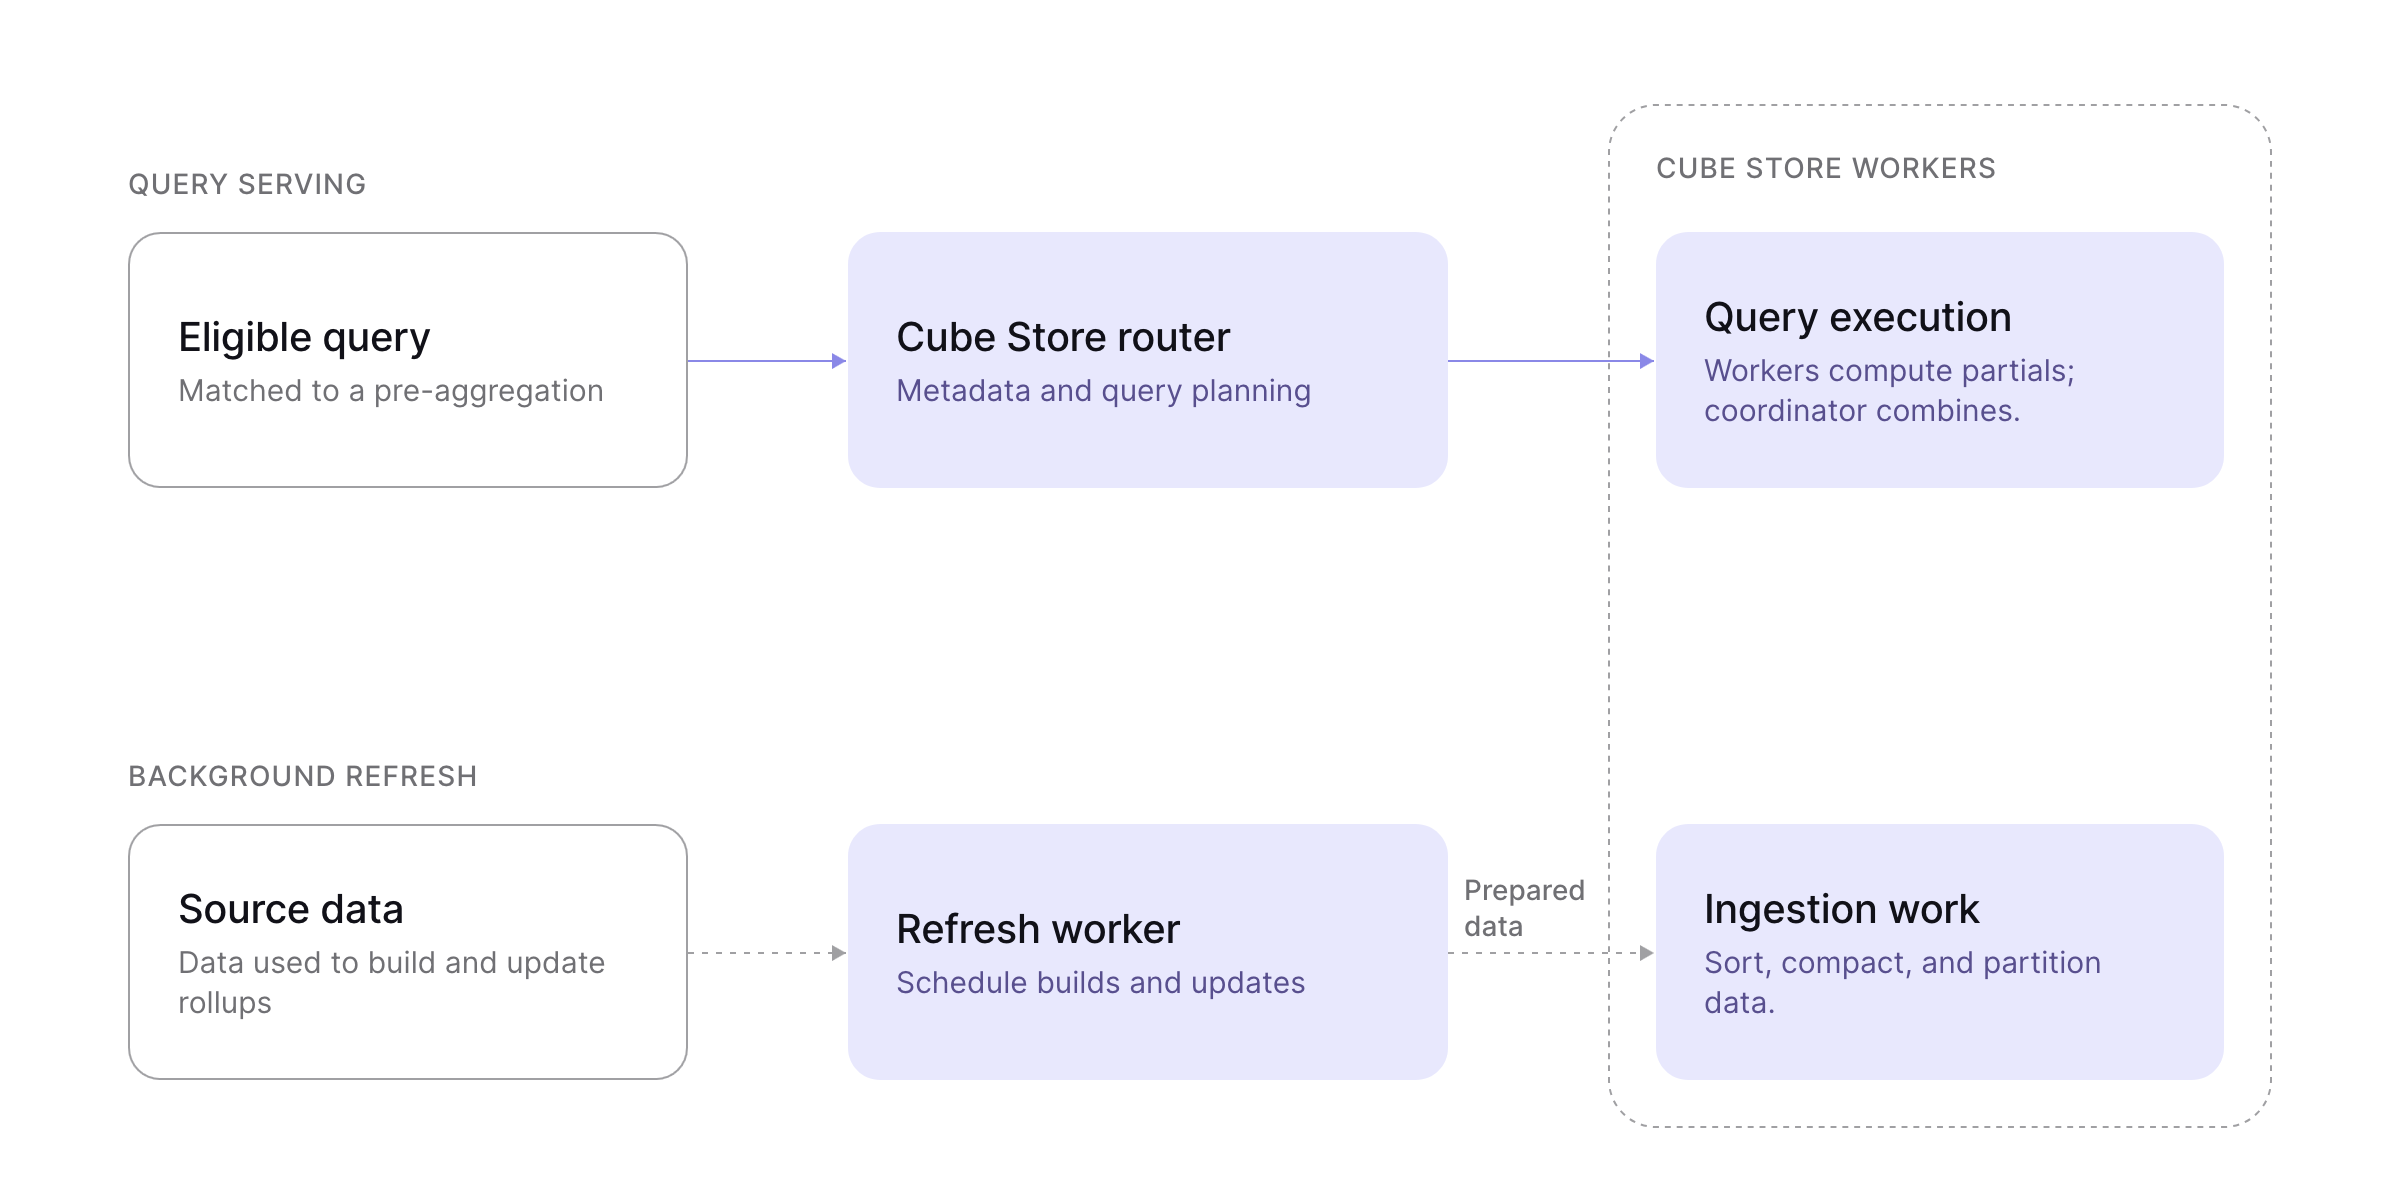
That has guided Cube Store's development: organize data for repeated reads, reduce intermediate work, and account for the preparation and coordination needed to keep serving it. The right configuration depends on the query families, their frequency, and the freshness the application needs.
Performance Benchmark
Our study uses 11 queries adapted from TPC-H, a benchmark for analytical decision-support queries. We modeled them as Cube views backed by pre-aggregations and recorded 43 query-and-scale combinations. The four source scale factors range from roughly 6 million to 6 billion line items.
Across those combinations, reported medians range from 173 to 620 ms, and p90 values from 291 to 879 ms, including network time. Every reported median and p90 is below one second. These are individual query statistics, not a pooled workload percentile.
Chart legend
- Q1, Q5, etc. identify queries from the TPC-H benchmark. This study uses adapted versions of those queries.
- SF1, SF10, SF100, SF1000 indicate the source-data scale factor, not the pre-aggregation size.
- Each cell shows median / p90 latency in milliseconds, including network time. Q11 at SF1000 was not reported.
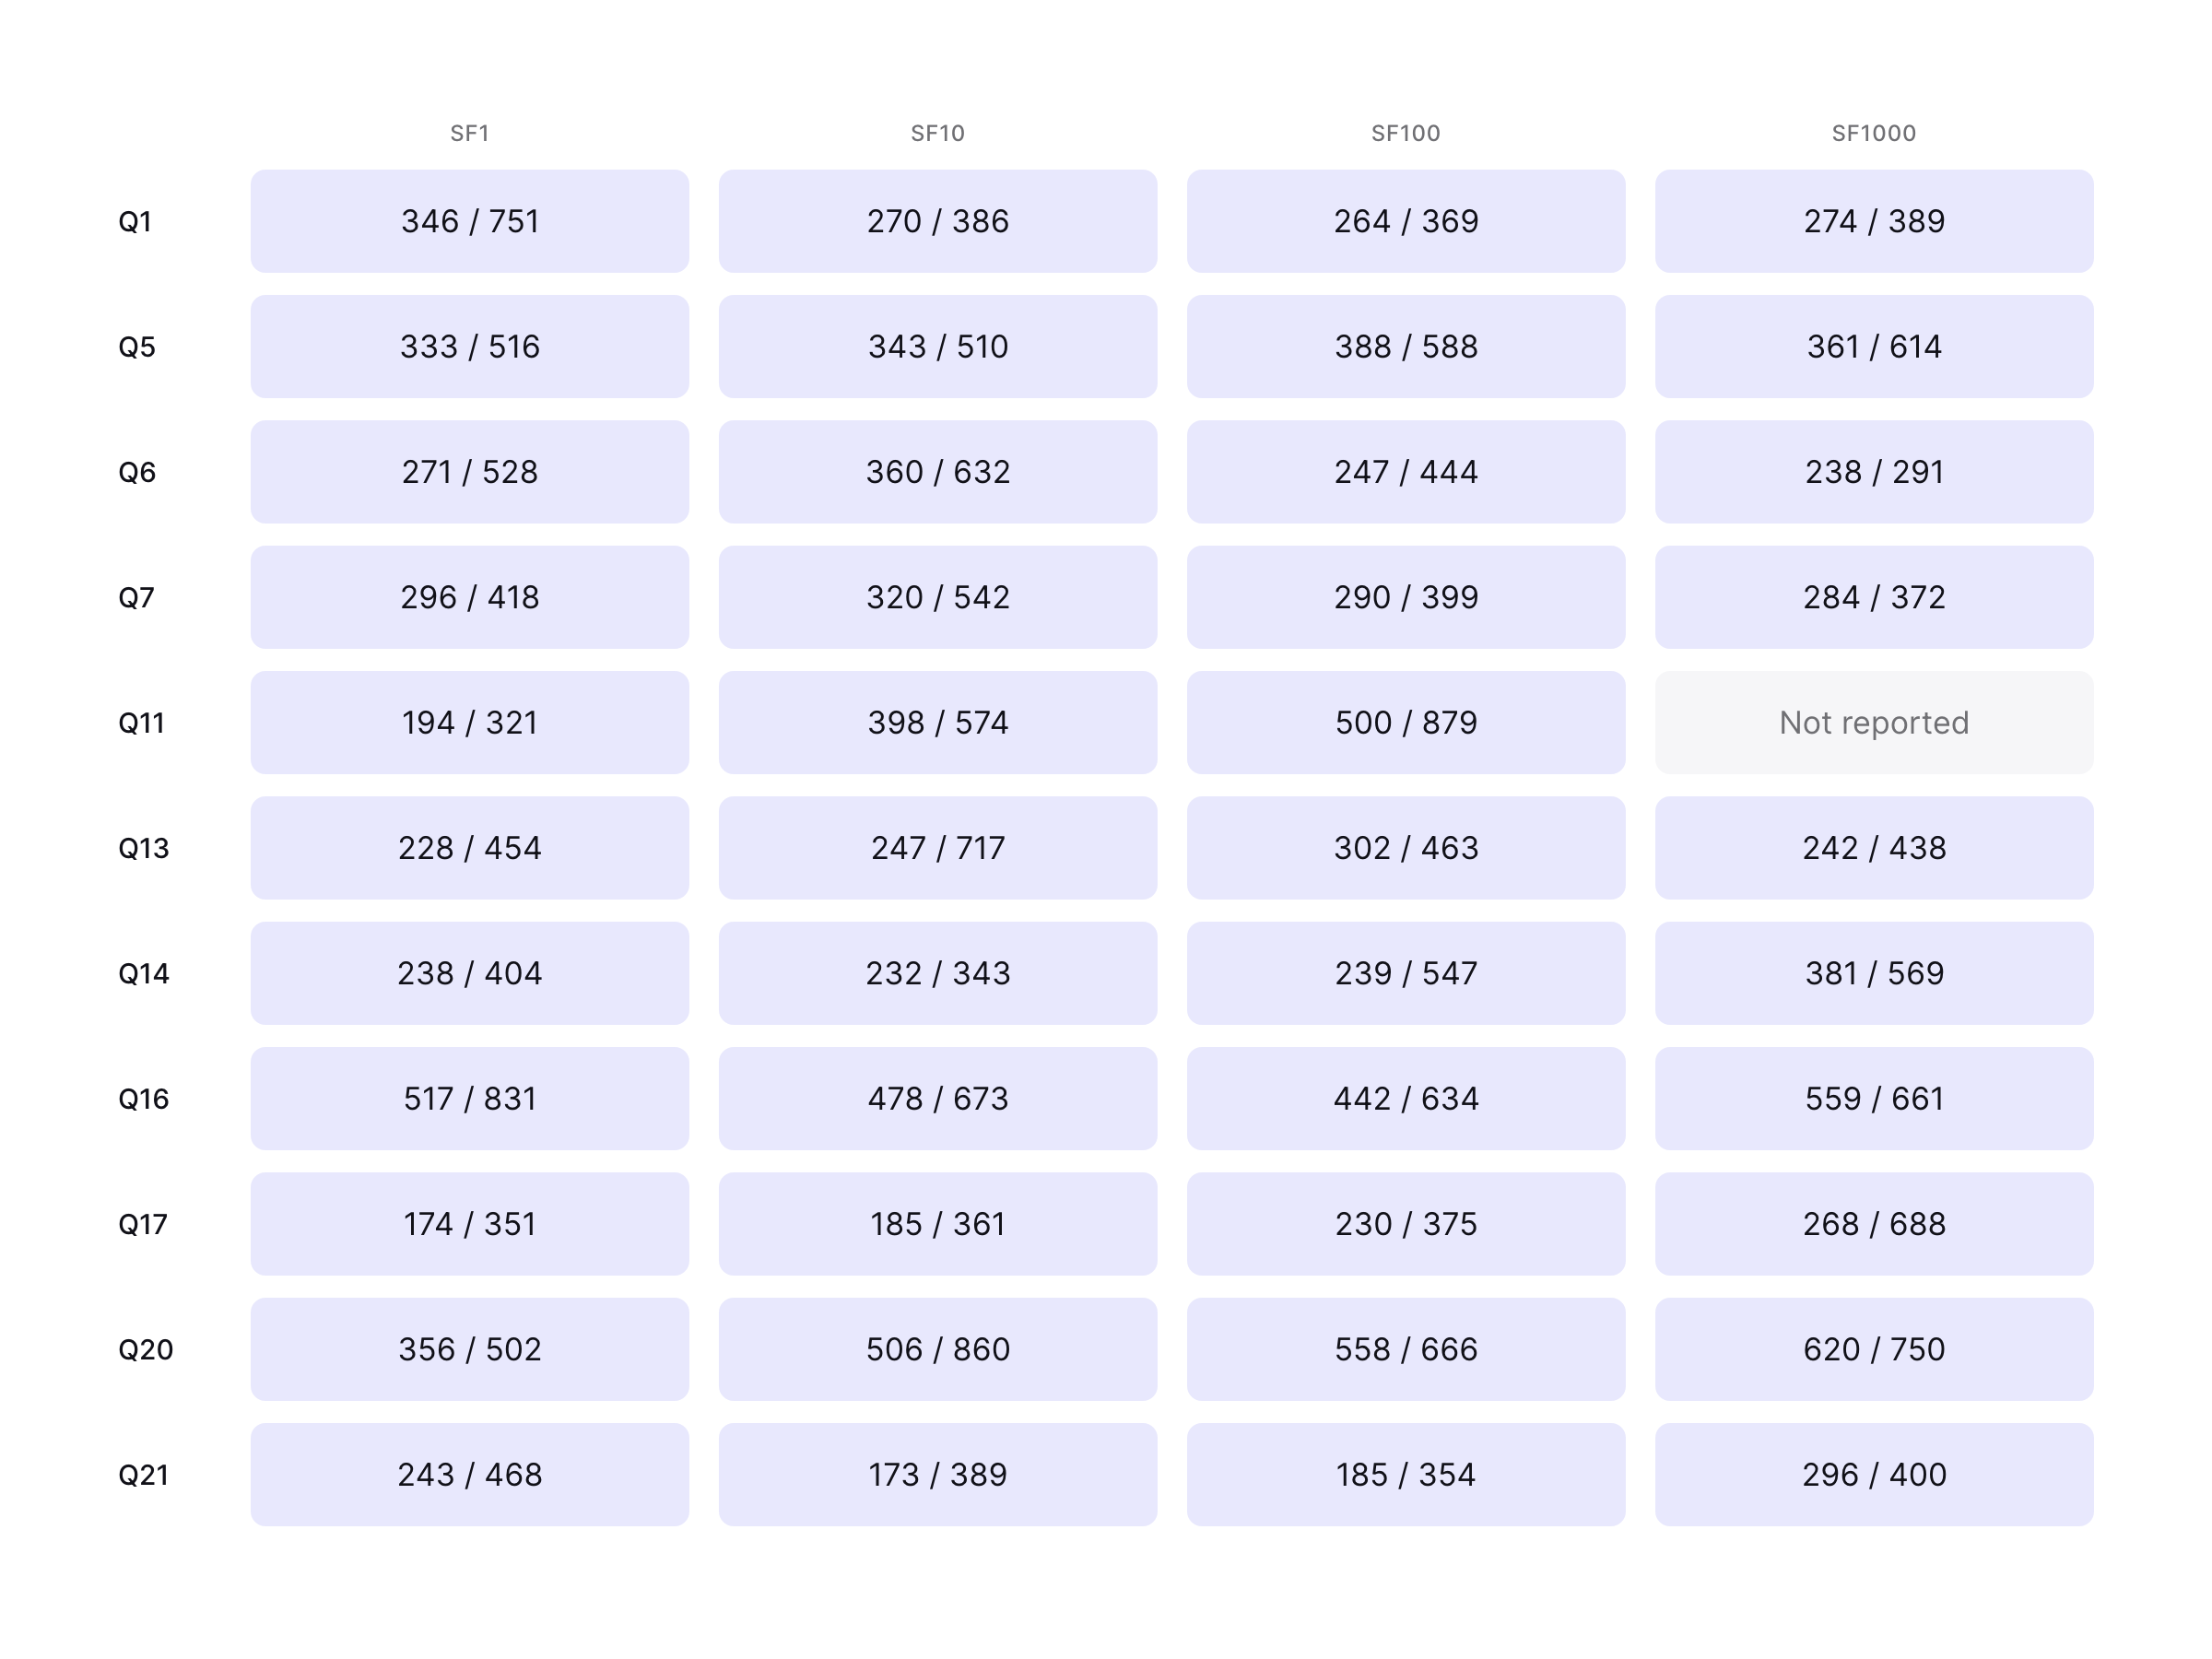
The prepared data behaves differently across queries. Q5 (Local Supplier Volume) uses a pre-aggregation that stays at 350 rows across all scales. Q20 (Potential Part Promotion) retains much more detail: its pre-aggregation grows from 800,000 to almost 800 million rows, while its reported median rises from 356 to 620 ms. Stored rows aren't scanned rows; the report doesn't include execution plans that show how much data each request reads.
The measurements used Cube 1.7.20 with Tesseract on a dedicated Medium deployment in AWS us-east-1. A client in Europe ran each combination 30 times on one open connection after a warm-up, timing through receipt of the last returned row.
These results document subsecond latency for the reported prepared workload. They don't isolate the contribution of individual engine optimizations or measure concurrent throughput, build cost, or a complete agent interaction. The accompanying ebook includes the full tables, methodology, and qualifications around query equivalence and returned-row limits.
For your own workload, start with the query families people and agents use, confirm their aggregate matches, and inspect the selected indexes and partitions. Then measure latency under representative concurrent traffic, including refresh activity. That's how to connect these architectural choices to the response time your application delivers.
Download A Query Engine for Aggregates for a closer look at the engine, all 43 reported measurements, and a guide to evaluating your own workload.