
An analytics dashboard often starts as one view in an internal tool or a customer product. The difficult part comes later: the same metric needs to mean the same thing in every chart, report, and application that uses it.
Cube is the agentic analytics platform built on a semantic layer. Cube Core is the open-source semantic layer: it gives applications a governed model and APIs for querying business data. Cube adds workbooks, dashboards, embedded analytics, and agent experiences that use the same model. For a custom dashboard, your app owns the interface and chart library while Cube provides the shared definitions and query path.
Updated for 2026: This walkthrough was first published in 2019. Its React examples use Create React App and
QueryRenderer, so treat them as a legacy implementation. For a current project, start with the Cube Core getting-started guide and the React SDK guide, which covers the current client anduseCubeQuery.
The separation that makes a dashboard maintainable is straightforward: define measures and dimensions once, then let each interface query those definitions. This walkthrough follows that path from a data model to charts; the embedded CodeSandbox examples below are snapshots of the original app.
Architecture
For a custom dashboard, keep the responsibilities clear: the application handles layout, interactions, and visualization; Cube handles the semantic model and serves queries through its APIs. That model can support an internal dashboard, an embedded analytics surface, and agent workflows without each consumer redefining metrics on its own.

API
Analytics starts with a database or warehouse that Cube can query. Choose a supported data source and follow the current Cube Core project guide to create a local project, connect the source in Developer Playground, and generate a data model. The guide also includes a sample Postgres dataset if you want to follow along without using your own data.
The getting-started project uses Docker Compose and exposes the local API and Playground on port 4000. Development mode is an authentication bypass intended for a developer's local machine; keep it off anywhere other people can reach the instance. For workload planning, use your query patterns and data source characteristics rather than a generic row-count threshold. A replica can help isolate analytics traffic, but it does not replace measuring the workload.
Cube Data Model
The next step is to define the data model. Cube uses measures and dimensions to generate SQL for queries. The model does not replace SQL; it gives your application reusable, governed definitions to query. The example below uses the JavaScript model syntax from the original tutorial. The current data-modeling guide covers both YAML and JavaScript models.
Measure is referred to as quantitative data, such as the number of units sold, number of unique visits, profit, and so on.
Dimension is referred to as categorical data, such as state, gender, product name, or units of time (e.g., day, week, month).
Conventionally, schema files are located in the schema folder. Here is an example of the schema, which can be used to describe users’ data.
Now, with the above schema in place, we can send queries to the Cube.js API about users’ data. Cube.js queries are plain javascript objects. Usually it has one or more measures, dimensions, and timeDimensions.
If we want to answer the question “Where are our users based?” we can send the following query to the Cube.js:
Cube.js will generate the required SQL based on the schema, execute it, and send the result back.
Let’s create a slightly more complicated query. We can add a timeDimensions to see how the ratio of different cities has been changing every month during the last year. To do this, we will add a signedUp time dimension, group it by monthly, and filter only last year’s signups.
Cube.js can generate simple schemas based on your database’s tables.
To do that, you can open localhost:4000 in your browser. You will see Developer Playground, a companion tool that will help you develop your Cube.js app.
Please navigate to the Schema tab, select the public schema, and click "Generate Schema". Great! You can inspect generated schemas and send test queries on the Build tab of Developer Playground.

Frontend
We’ll build the original frontend with React, but Cube is visualization-agnostic: you can use any framework or charting library. For a new React application, use the current React SDK guide; the walkthrough below keeps its older Create React App and QueryRenderer code so you can see how the original dashboard was assembled.
This example's .env file contains a local-development placeholder. The public token shown in old copies of this tutorial is not a credential to reuse. The React SDK documentation explains how the client connects to local and authenticated Cube deployments.
Run the following commands to create the frontend used in the original example:
Before we start the app, create a .env file with the local API URL and placeholder used by this legacy example:
Now we can start the app:
The last line starts a server on port 3000 and opens your web browser at localhost:3000.
We’ll build our UI with Reactstrap, which is a React wrapper for Bootstrap 4. Install Reactstrap and Bootstrap from NPM. Reactstrap does not include Bootstrap CSS, so this needs to be installed separately:
Import Bootstrap CSS in the src/index.js file before importing ./index.css:
Now we are ready to use the Reactstrap components.
The next step is to install Cube.js client to fetch the data from the server and our visualization library to display it. For this tutorial, we’re going to use Recharts. Cube.js is visualization agnostic, meaning you can use any library you want. We’ll also use moment and numeral to nicely format dates and numbers.
Finally, we’re done with dependencies, so let’s go ahead and create our first chart.
Replace the contents of src/App.js with the following:
You can check out this example in the CodeSandbox below.
Let’s look deeper at how we load data and draw the chart.
First, we’re initializing the Cube.js API client:
As you know, we've created the .env file with the credentials. In the development mode, Cube.js doesn't enforce the use of the token to authorize queries, so you can use any string for your token in REACT_APP_CUBEJS_TOKEN. You can learn more about using and generating tokens in the production environment in the docs.
Next, we are using the QueryRenderer Cube.js React component to load Orders data.
QueryRenderer performs an API request to the Cube.js API and uses the render props technique to let you render the result however you want to. We’ve already covered the query format above, but in case you want to refresh—here is the query format full reference.
The render parameter of QueryRenderer is a function of the type ({error, resultSet, isLoading}) => React.Node. The output of this function will be rendered by the QueryRenderer. A resultSet is an object containing data obtained from the query. If this object is not defined, it means that the data is still being fetched.
resultSet provides multiple methods for data manipulation, but in our case, we need just the chartPivot method, which returns data in a format expected by Recharts.
We’ll plot the Orders data as a bar chart inside a responsive container.
Building a Dashboard
We learned how to build a single chart with Cube.js and Recharts, and we are now ready to start building the whole dashboard. There are some best practices regarding designing the layout of the dashboard. The common practice is to put the most important and high-level metrics on the top as single value charts, sometimes called KPIs, and then list the relevant breakdowns of those metrics.
Here is the screenshot of our final dashboard with KPIs on top followed by bar and line charts.
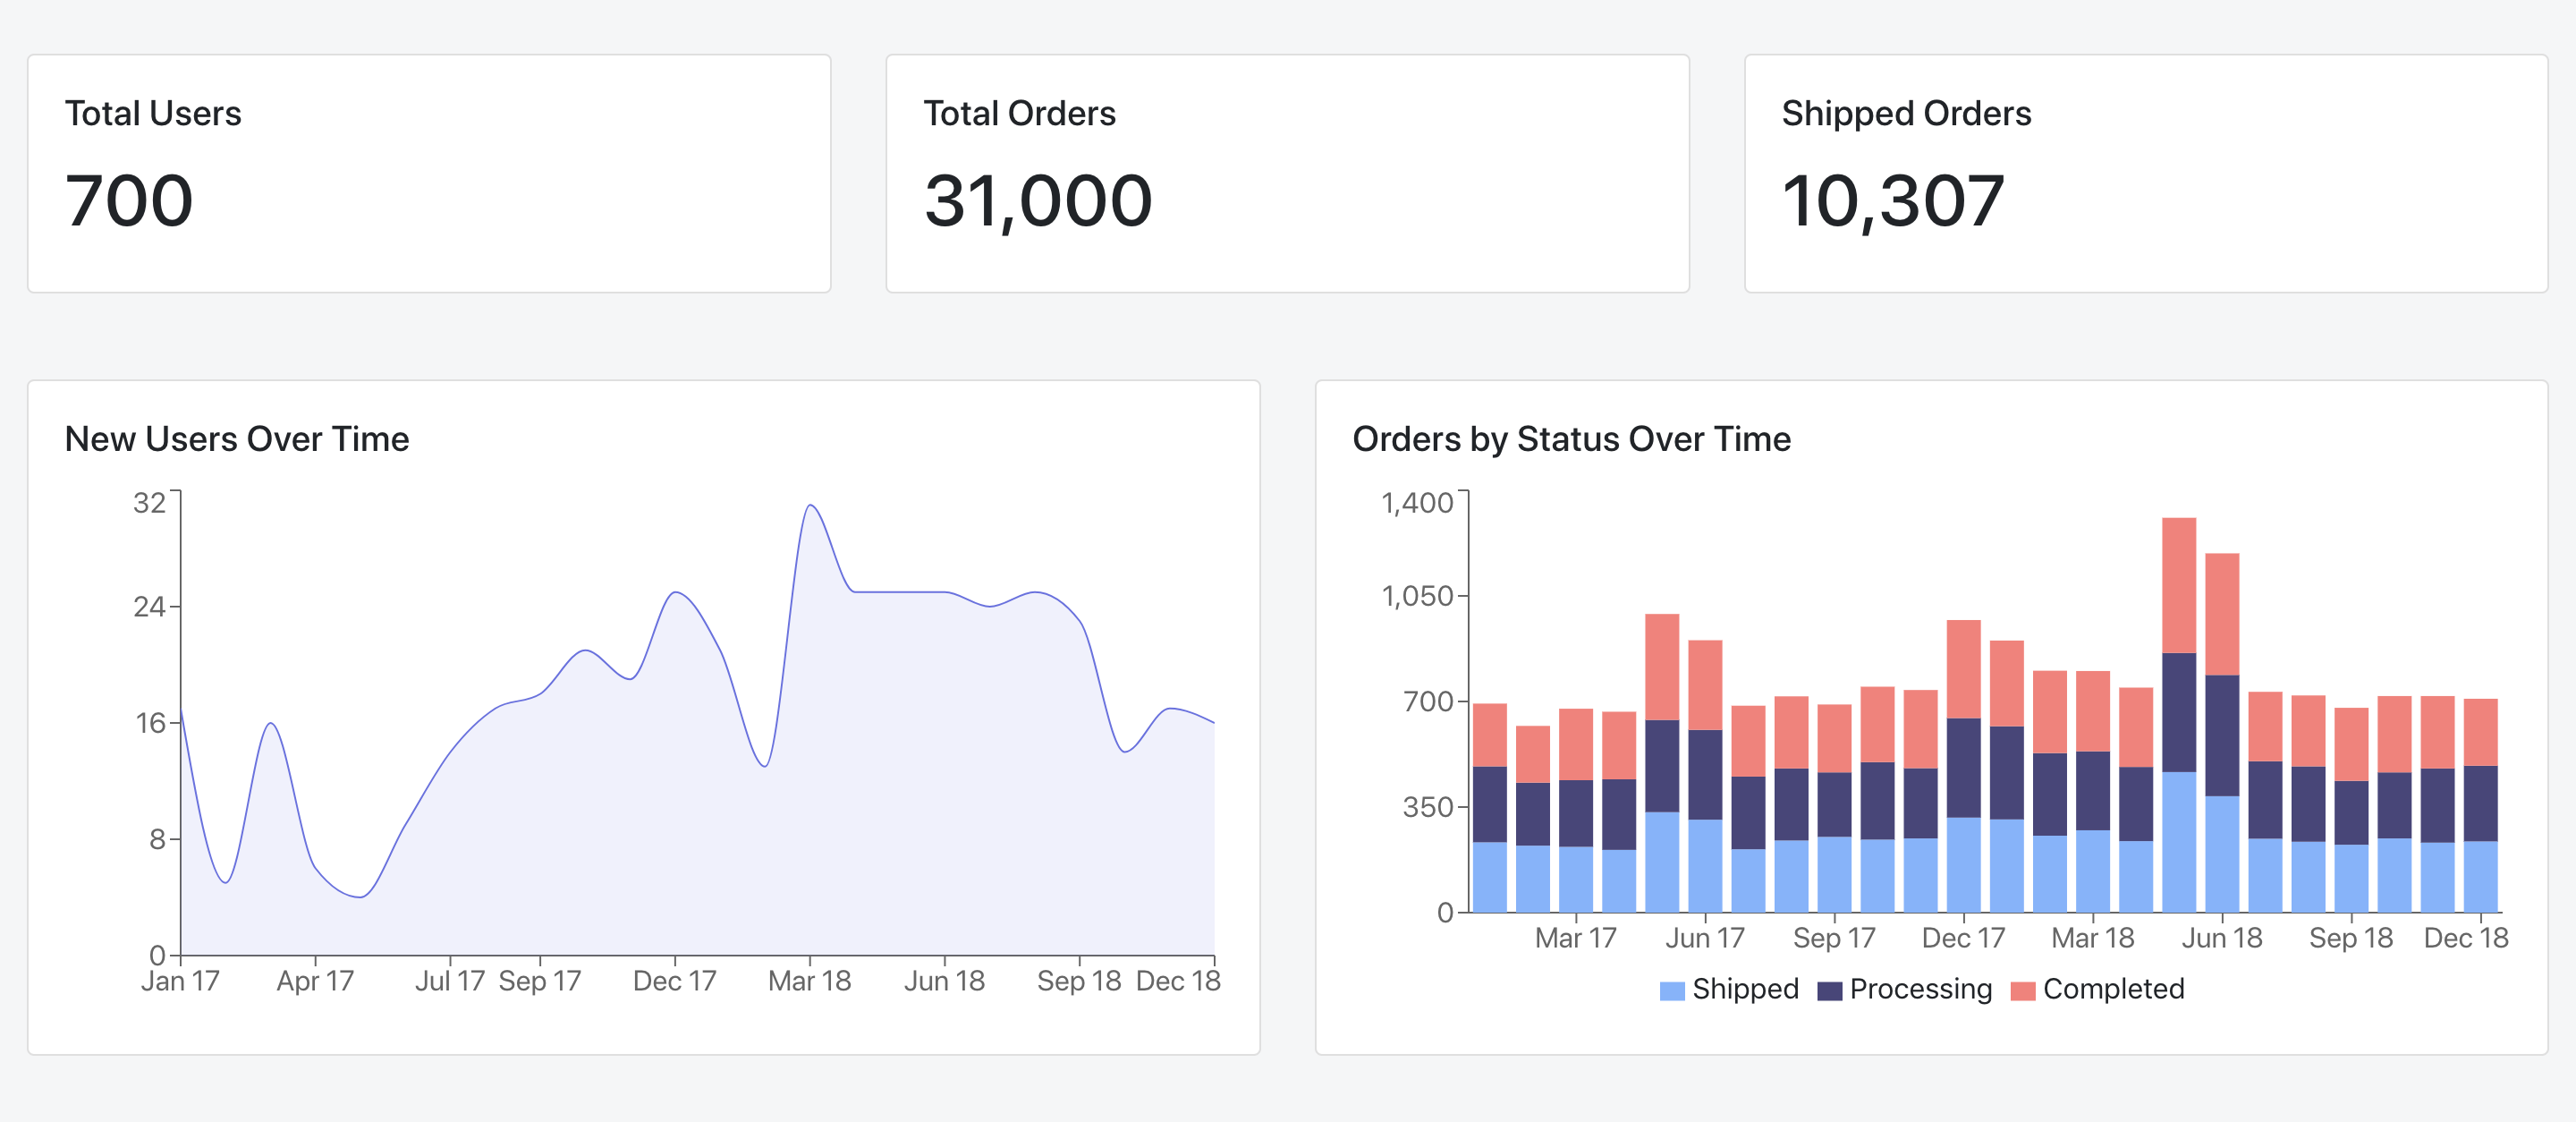
First, let’s refactor our chart and extract the common code into a reusable <Chart /> component. Create an src/Chart.js file the following content:
Next, let’s use this component to create the dashboard. Replace the content of src/App.js with the following:
That is enough to build our first dashboard. Give it a try in the CodeSanbox below.
Next Steps
For a new self-hosted project, continue with Cube Core's getting-started guide. For a custom React interface, use the React SDK documentation; for the model itself, see the data-modeling guide.
If you want people and AI agents to explore the same governed data through self-service analytics, Try Cube for free.