In case you missed it, we recently released Cube’s SQL API, with expanded support for BI tools and data notebooks.
That’s exciting (we’re very excited) because consistent, performant, and secure data is now accessible to any data consumer in your company—from app developers to general business users. Cube’s definitions are consistent across every application.
Think of your favorite BI tools: if they can connect to a data store via SQL, they’ll work with Cube.
To illustrate the beautiful simplicity of connecting a BI application to Cube via our SQL API, we’re here with a quick tutorial using Tableau Online and Cube Cloud.
Let’s dive in.
Get started with Cube Cloud
This tutorial assumes you’re using Cube Cloud—and why wouldn’t you? Our managed service is both the fastest and most secure way to run Cube—and it’s free.
If you don’t have a Cube Cloud project already, sign up for a free account here, then follow these step-by-step instructions to create a project. Don’t worry if you’d rather not connect your own database to Cube for this tutorial: we’ve got you covered with a sample database.
If you already have Cube Cloud set up, feel free to jump here.
Define measures and dimensions
When you create a project, you’ll notice that Cube automatically generates a basic data schema. But for this tutorial, let’s define at least one custom measure or dimension in Cube’s schema editor, too. You’ll use it in a few minutes.
In the left-hand navigation, select the schema editor and enter Development Mode.
In this example, in the cube Orders, we’ll define a new measure, totalAmount…

…save our change, and Commit and Push it to production:

The new definition is automatically added to Cube’s API, and you’re ready to…
Grab SQL connection details
Navigate to the overview page and find the “SQL API” section. Click “How to connect your BI tool”.

Here, you’ll find the details you need to connect Tableau Online to Cube:

You’ll need these when you…
Configure Tableau
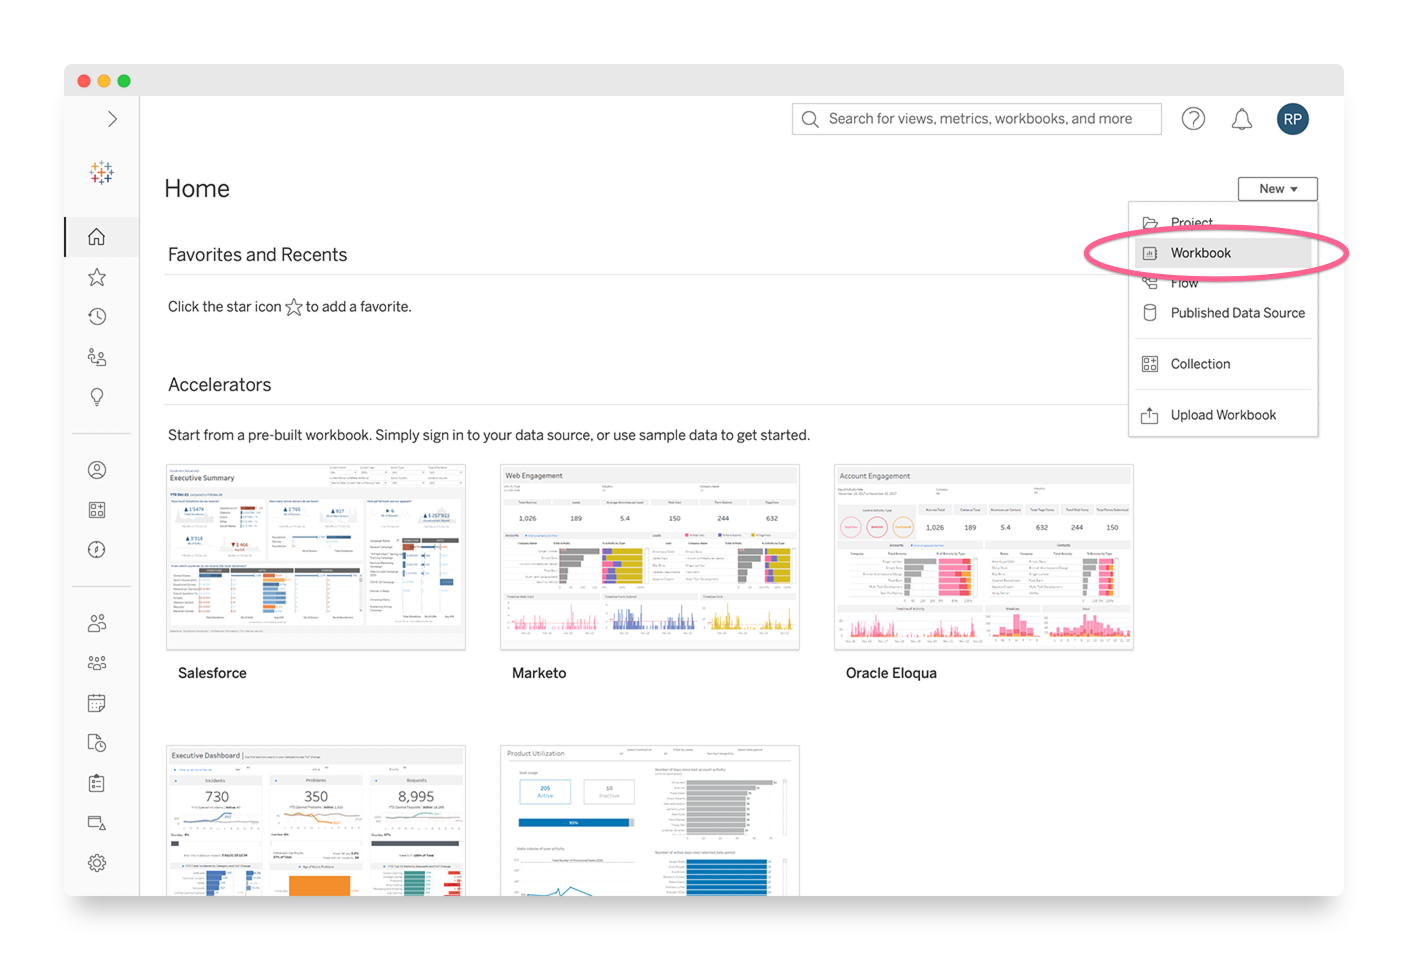
Let’s make a new Workbook using the menu at top right:
In the “Connect to Data” screen, select PostgreSQL.

You’ll be prompted to add the connection details you opened in Cube. Copy, paste, and click “Sign In”.
Understand Tables and Fields
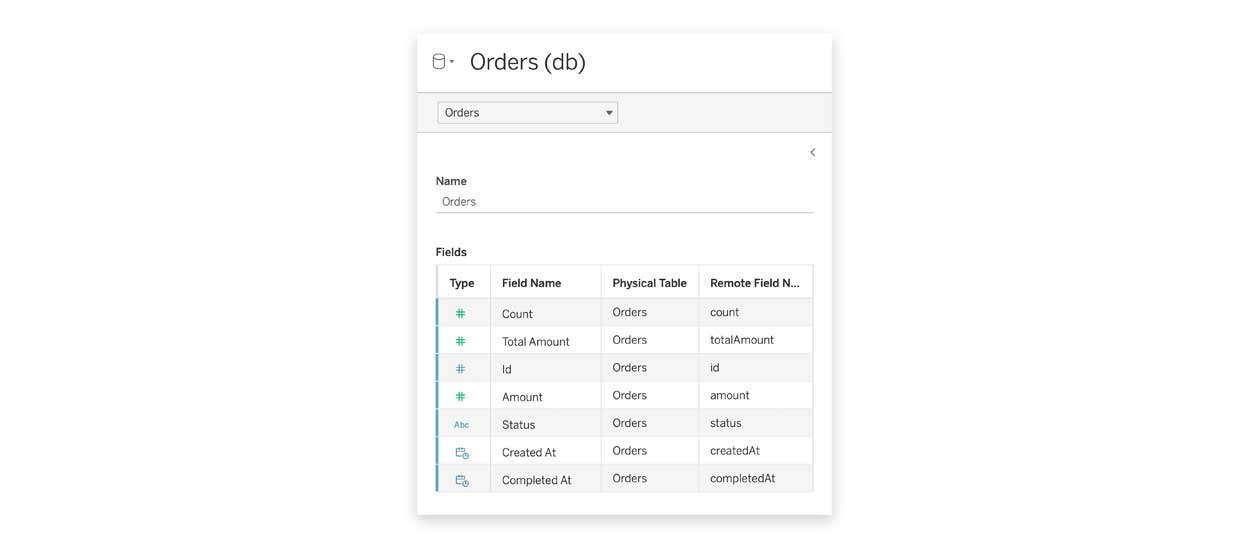
If all goes according to plan, you’ll now see a list of each of your cubes listed as Tables.
Drag one of them—we’ll use Orders again—into the Workbook editor to begin exploring.
Et voila: now, every measure and dimension from Cube is available as a Tableau Field, including the custom measure we defined earlier, totalAmount.
Build a worksheet
Now it’s time to try this out!
Build a simple chart in Tableau: drag a measure to “Rows” and a dimension to “Columns”:
Just like that: your first Cube-powered visualization in Tableau!
Learn more
As you can see, connecting Tableau to Cube via Cube’s SQL API makes Cube definitions accessible to every data consumer—so the same data can flow to both business users and data application developers.
Interest piqued? Check out our SQL API docs, and our guide to working with other BI tools.
And, watch this space because the fun is just beginning: we’re continuing to test and improve connectors for more BI applications. Have a favorite? Let us know.