
In this blog post, we'll walk through the steps to create a Tableau-like data visualization using Muze, a free JavaScript charting library powered by WebAssembly, for the front-end and Cube for the analytical API.
We thank Nakshatra Mukhopadhyay, a software engineer at Charts.com, for contributing this blog post.
A. Introduction
In the spectrum of JavaScript data visualization libraries, most libraries position themselves at one of two extremes: monolithic charting libraries (e.g., Highcharts, Chart.js, or amCharts) or modular, low level libraries (e.g., D3.js).
The charting libraries are very easy to get started with but do not provide a lot of control over their behavior in advanced use cases. On the other hand, D3.js provides incredibly fine grained control over every aspect of its behavior but that comes at the cost of a steeper learning curve and a lot of glue code to bridge all of its modules together into a cohesive visualization system. And neither of these two approaches have much knowledge about the structure and attributes of the data being fed to them without significant implementation effort.
MuzeJS by Charts.com is a free JavaScript library which makes it easy to create Tableau-like charts in the browser. It bridges the gap between the previous two approaches to data visualization by taking a data-first approach. Using the table of data provided to it, it can make intelligent inferences about the data to better create a cross-interactive visualization system that has powerful slicing and dicing capabilities, just like Tableau—but in the browser.
Incidentally, this approach also fits well with Cube' paradigms. In this blog post, we're going to build a data-driven chart in React using Cube and MuzeJS, with data stored in a PostgreSQL database. We'll let Cube interact with our database, shave off most of the data and send the required subset of it to the front-end. Once the data is on the front-end, we'll use MuzeJS and its blazing fast DataModel to visualize it.
Here's a peek at what the end result will be!
Looks daunting, right? Don't worry! With Cube and MuzeJS generating this visualization is easy. Installing and setting everything up is honestly what's gonna take longer! 😅
Let's get crackin'!
B. Pre-requisites
- Familiarity with programming concepts, Ubuntu, the UNIX terminal, SQL, JavaScript, React and npm is assumed for the purposes of this tutorial.
- Working installations of Ubuntu ≥ v16.04, NodeJS ≥ v10.13.0 and npm ≥ v6.4.1
C. Installing PostgreSQL and
First things first—let's get our database set up. In this example we'll be using PostgreSQL.
Cube can connect with a lot of databases other than PostgreSQL. You can check out the full list here.
Fire up the terminal. At the prompt, we are going to install PostgreSQL 12 by running the following command:
Provide the user's password, if asked, and wait for the installation to complete. The installer will automatically create a Ubuntu system user called postgres as well as a PostgreSQL superuser called postgres with all necessary permissions to work with PostgreSQL databases.
The installer will also have started a PostgreSQL server. You can see the status of the server at any time using the command pg_lsclusters. If, in the output of pg_lsclusters, the server's "status" is "down", you can start the server using sudo pg_ctlcluster 12 main start (you may be prompted for your password here as well).
Now, we'll be creating a PostgreSQL Role against our Ubuntu username.
- Note down the name of the current system user that we're using Ubuntu as.
This command will output our username. We are going to need this information in just a bit.
- Switch over to the
postgressystem user (which was created by the PostgreSQL installer).
After asking for your user's password, the shell prompt will change to indicate you're logged in as postgres in postgres' home directory.
- Start the PostgreSQL shell.
The terminal prompt will change to show that you're now in the PostgreSQL shell.
- Create a PostgreSQL Role with the username that we got with the
whoamicommand.
Replace <whoami_result> with the Ubuntu system username and replace <password_here> with your desired password.
This will have created a PostgreSQL Role with the name of the Ubuntu system user's name and given it permission to create databases and log into PostgreSQL with the password chosen.
- Quit the PostgreSQL shell.
You'll now be in the shell of the postgres system user.
- Log out of the
postgressystem user's shell.
You're now back in the original Ubuntu user's shell.
- Create a PostgreSQL database against your username.
Now, you will be able to connect to PostgreSQL with your Ubuntu user instead of having to switch over to the postgres user every time.
The next thing to do is loading a sample dataset.
In this example we are going to use Cube sample e-commerce dataset found here.
- Download the dataset and save it in a file named
ecom-dump.sqlin the home directory.
The above command will download the sample dataset from Cube.js' servers and save as ecom-dump.sql. After the download has completed you can check whether the file has been created using the ls command.
- Load the
ecom-dump.sqlfile into PostgreSQL to create the database.
This will have created a database named ecom in PostgreSQL from the ecom-dump.sql file.
- Start the PostgreSQL shell.
The terminal prompt will change to show that you're now in the PostgreSQL shell.
- Let's quickly check whether the
ecomdatabase has been created successfully.
That will output a table onto the terminal where we should be able to see a database with its "Name" as ecom.
- Quit the PostgreSQL shell.
So, now let's take a quick tour of the Cube e-commerce dataset.
- Start the PostgreSQL shell.
- Connect to the
ecomdatabase.
- List the tables in the database.
It should show the list of tables in the ecom database: line_items, orders, product_categories, products, suppliers and users.
For the purposes on this walk-through, we'll be focusing on four of these tables: users, orders, products and product_categories.
- Take a look at the users table...
...then the orders table...
...the products table...
And, finally, the product_categories table.
With the structures of those tables in out minds, lets plan out what we want to visualize with MuzeJS.
- Quit the PostgreSQL shell.
D. Planning the Task Ahead
Let's imagine that we want to visualize the split between the quantity of orders placed by our male and female customers across all products categories in every city for the year 2019.
Let's break that statement down. We'll refer to the tables we printed above to help us plan.
We can figure out the quantity of orders by counting the entries in our orders table. Its user_id column allows us to refer to the users table by id from where we can find information about the gender and city of the user who placed the order. The orders table also has a product_id column which maps to the id column in the products table. The products table, in turn, has a product_category_id column which maps to the id column in the product_categories table. Thus, the "join path" for our use case looks like the following.

Fortunately, the Cube CLI can analyze our database structure and create simple join paths for us automatically! We simply make our queries using Cube.js indicating what results we want and it'll will take care of generating efficient SQL statements to query our ecom PostgreSQL database across all necessary tables and return the result.
Once the result is ready, we'll use a small helper function to extract some meta information about the results. We'll provide this information along with the result table to MuzeJS and ask it to plot the charts. And bada-bing bada-boom! We'll have our visualization ready. Easy!
E. Understanding Measures and Dimensions
Before Cube can communicate with our database and before MuzeJS can visualize our data, they first need information about the columns of our tables. Cube calls this information cubes which are an essential part of the data schema. MuzeJS also calls them the schema. At the least, both Cube and MuzeJS need to know which of the fields in the tables are measures and which are dimensions.
Measure is a term used to refer to quantitative data. In our examples, the number of products sold is a measure. Other examples of measures could be the average temperatures of a region, the maximum price of a stock, etc. As is evident from their naming, they can be "measured" by using some instrument and can have mathematical functions applied on them to summarize them, such as average, mean, max, etc.
Dimension is used to refer to categorical data; such as the gender or the city of a customer, the name of a product, etc. These are generally distinct in nature and can't usually be measured by instruments. They also cannot be summarized using mathematical functions. Instead, they serve to categorize the measures that we have recorded.
Other than the usual kinds of dimensions like city names or product categories, there is also a special type of dimension—the dimension of time, often referred to as the temporal dimension. Time needs special treatment because we can treat it as distinct units, like January is clearly distinct from June. But at the same time, it is also continuous in nature: 2020 can't come before 1980 for example.
F. Analytical API with Cube
Cube will help us scaffold out our project's analytical API and will be useful for generating authentication tokens to use with MuzeJS. Let's go get that npm install-ed now.
Use npm to install the cubejs-cli package globally on your system.
After the installation is complete the cubejs command should be available to the system. Run cubejs -V to double-check. The version of the Cube CLI that was installed should be output to the console.
G. Preparing the Analytical API
- Navigate to a directory which will contain our project and scaffold out a back-end for our project using the Cube.
This will create a npm project in a directory called dashboard-backend in the location where the above command was run. It will have the the Cube server installed and configured to use PostgreSQL as the database.
cdinto thedashboard-backenddirectory.
- Replace the contents of the
.envfile with the following block. Replace<USERNAME_IN_C.II.4>and<PASSWORD_IN_C.II.4>with the database username and password created earlier in this article. TheCUBEJS_API_SECRETwill not be of particular use during this tutorial and during development. You can set it to be any string you want. But, in production you should ensure that the values are properly set and used to generate your authentication tokens. More information about Cube.js security can be found here.
Pro tip: never commit your .env files to the version control. They are meant to contain machine and user specific secrets which can be dangerous in the wrong hands.
Cube. will use the values defined here when communicating with our database and our front-end.
- Generate the cubes for the database tables that we are interested in: orders, users, products and product_categories.
Provided that our database is running in the background and our .env file contents are correct, Cube will generate the cubes for our tables in the schema directory within the dashboard-backend project. You can open up the files in the schema directory and check out the generated cubes. In the future, as you get more familiar with Cube.js you will be able to modify the contents of these files as you need. For this walk-through, however, the generated cubes will be sufficient. You can find more information about the Cube.js schema here.
- Start the Cube development server. When generating the
dashboard-backendproject, the Cube CLI also helpfully created apackage.jsonfile with the script to run our development server onhttp://localhost:4000.
Our front-end will be sending the queries for data to the Cube server at http://localhost:4000.
- Initialize the Cube Playground by visiting
http://localhost:4000in your browser. While we will not be using the playground much in this article, you'll likely need to get familiar with it as you explore Cube on your own. You can find more information about the Cube playground in the Cube.js documentation pages. - We'll keep the Cube development server running in the current terminal. OPEN UP A NEW TERMINAL before proceeding with the next steps.
H. Preparing the Frontend
We'll begin by installing all our dependencies and then move to creating our visualization.
- Navigate to the directory which contains our
dashboard-backendproject. Just to be clear—do NOT go into thedashboard-backenddirectory. Our front-end will be located as a sibling todashboard-backendin our filesystem. - Create a new React project using
create-react-app.
cdinto thedashboard-frontenddirectory.
Now we can install the Cube Client.
- Install the Cube client and the React bindings for Cube.
- Create a
.envfile indashboard-frontendwith the following content.
Again: never commit your .env files to version control. They are meant to contain machine and user specific secrets which can be dangerous in the wrong hands.
Remember we started the Cube server at http://localhost:4000 back in Section G, Step 5? In development mode, Cube makes its query endpoint available there under /cubejs-api/v1. When deploying to production you should change this URL to the location where the Cube server is running. More information about deploying Cube can be found here. We'll use the REACT_APP_API_URL when making queries for our data.
Similar to the CUBEJS_API_SECRET, the value of REACT_APP_CUBEJS_TOKEN is not important during development. You can set it to be any string you want. However, in production you should generate your tokens using the CUBEJS_API_SECRET. More information about security, tokens and secrets are in the Cube.js docs here.
Now it's time to install MuzeJS!
We'll follow the installation instructions as in the React-Muze installation documentation.
- Install MuzeJS and the React-Muze.
- Install Copy Webpack Plugin.
We'll use this Webpack plugin to copy over MuzeJS' assets during compilation.
- Install React App Rewired.
Create React App does not provide direct access to the underlying Webpack configuration. Instead, we'll use React App Rewired package to use the Copy Webpack Plugin with Create React App.
- Create a new file called
config-overrides.jsinside thedashboard-frontenddirectory, at its root. Populate it with the following code.
The exported function is very simple. If a plugins array is not already present in Webpack's config, we create it. Then we tell Copy Webpack Plugin to copy everything from MuzeJS' dist directory. We push the Copy Webpack Plugin into the plugins array and return the modified Webpack configuration.
- In
dashboard-frontend'spackage.jsonfile'sstart,buildandtestscripts, use React App Rewired instead of React Scripts. DO NOT change theejectscript to use React App Rewired.
React App Rewired will now use the function exported from config-overrides.js when running, building and testing our React application.
I. Visualizing the Data with React and MuzeJS
Whew! Alrighty! Everything's installed and set up and prepared. Let's get to visualizing our data. Reminder: we want to visualize the split between the quantity of orders placed every month by our male and female customers across all products categories in every city for the year 2019.
Open up the file dashboard-frontend/src/App.js and delete its contents. We'll be starting from a clean slate.
Now we can initialize Cube:
- Extract the values we put in the
.envfile in Section H, Part II, Step 2 fromprocess.env.
Create React App, very helpfully, has injected the values we provided in the .env file in the global process.env.
Create React App only does this injection for the keys in the .env file which begin with "REACT_APP_". Other values in the .env file are not injected.
- Import
cubejsfrom@cubejs-client/coreand initialize thecubejsApiwith the Cube token and API URL.
We will use this cubejsApi to make queries against the Cube back-end.
- Prepare the query for Cube. We'll start simple and see what the query for the total number of orders that have ever been placed looks like.
Recall our discussion about measures and dimensions. Here, the number of orders is, of course, a quantitative value and hence, a measure. Since we can query multiple measures in a since object, Cube accepts an array of measures in its query object. The format of every measure is a string in the form <TABLE_NAME>.<FIELD_NAME>. Our table name is Orders and field name is count.
You won't find the count field directly in your database tables, but if you check out the schema in the dashboard-backend/schema/Orders.js file generated by Cube in Section G, Step 4, you'll find that a count field is defined in the measures section of the schema. You can find more information about the Cube schema in the Cube docs here.
Let's refine the query so that it includes results for every month of the year 2019.
For time fields, Cube asks for all the information in a property called timeDimensions in its query. Within it, we provide dimension name, the date range and the granularity of the result we need. The granularity is important here because our data in the database contains details for every single day; but in our visualization, we are going to show data aggregated into months.
Now, we'll add our dimension fields to our query. We need the gender of our users, the city they are from and the product category that they have ordered from.
And voila! Our Cube query is ready!
Now we can create our React Component.
- Create and export the React Function Component from the
dashboard-frontend/src/App.jsfile.
We'll return an empty React Fragment for now. We'll replace it with the MuzeJS' React component soon.
- Import and use Cube' React hook for making queries inside out React component. We'll use the
CUBE_QUERYwe've already created.
The resultSet returned from useCubeQuery provides several methods to interact with the resultant data. We'll primarily be using two methods available on resultSet: pivotTable and annotation. The pivotTable method returns the fetched data as a flat JSON object. We can directly pass it to MuzeJS. The annotation method returns some meta-information about the resulting data. We'll use this to create the schema for MuzeJS.
- Since MuzeJS is a table driven visualization library, we'll get its data table ready first. MuzeJS provides a entity called a DataModel as its data source. This DataModel requires two things to initialize it with: a data and a schema. The data is received straight from Cube.js via the
pivotTablemethod on theresultSet. For the schema, we'll use the meta-information returned by theannotationmethod onresultSet. Let's examine the return value of theannotationmethod.
Now, we want to convert the above object into an object of the form below.
Note that the DataModel's schema shares some of the same fundamental concepts with Cube schema, such as measures, dimensions and time dimensions.
To convert the resultSet annotation object into a schema compatible with DataModel, we'll simply iterate over the measures, dimensions and timeDimensions, extract their names (e.g. "Orders.count") and titles (e.g. "Orders Count") and concatenate them into an array. Here's a function which shows one way of doing that.
- Initialize a state variable which will contain the DataModel instance once its ready. Initially, we'll let its value stay
undefined.
- Inside a
useEffecthook, we'll instantiate the DataModel. For its data, we'll use the value ofresultSet.tablePivot()and for the schema we'll use the return value of thegenerateSchema()function (defined in Step 3 just above) after we passresultSet.annotation()to it.
- Replace the empty React fragment returned in Step 1 above with MuzeJS' React component.
We've also added a loading message to our component which will be shown while Cube fetches the data and the DataModel parses it. This loading message can simply be replaced with some Spinner component if needed.
- Add a
Canvascomponent as a child of theMuzecomponent. ThisCanvasdefines the various properties of our visualization, such as thewidth,height, the fields to be plotted acrossrowsandcolumns, etc. As a child of the Canvas component, we specify theLayerwith amarkprop which indicates the plot type with which to plot the data.
Here, we've defined a 1440px by 900px Canvas and plotted the values of Orders.createdAt.month on the columns, i.e. the X-Axis and Orders.count on the rows, i.e. the Y-Axis. The mark for the Layer on which the data will be plotted is set to be bar.
- Save the
dashboard-frontend/src/App.jsfile and start the Create React App development server.
A webpage should open up in your system's default browser and show a visualization like the one below. Nice!
- Here's where the real fun begins!
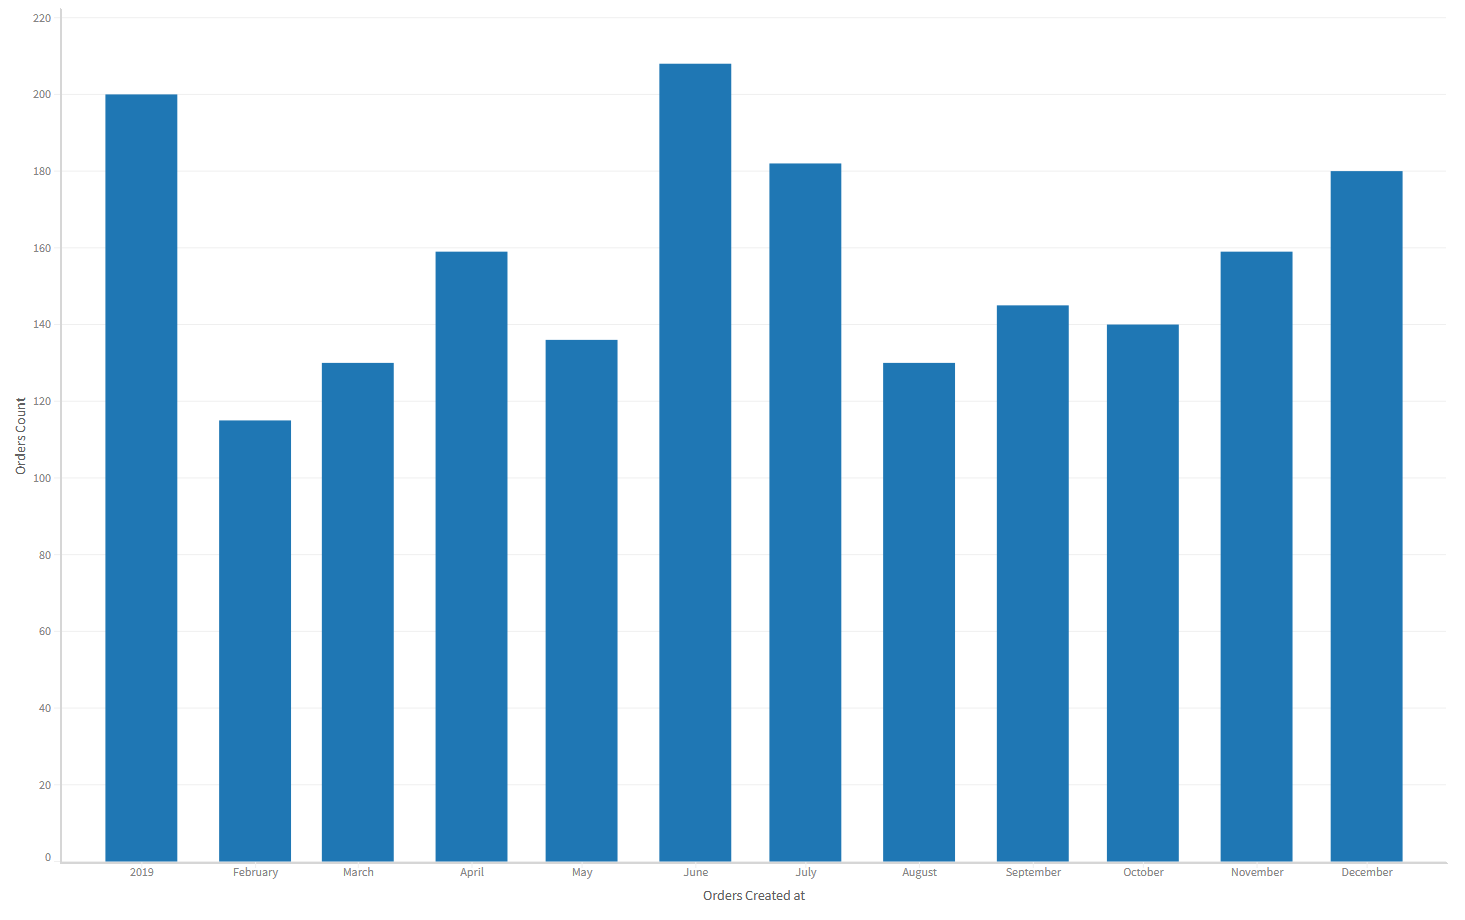
You'll notice that the chart we rendered simply shows us the number of orders placed every month in 2019. Let's visualize some more details! First, we'll color each bar with separate colors to indicate how much of the orders were by male customers as versus female customers! We'll add the colors prop to the Canvas component and set its value to be Users.gender.
Save the file and you should see this in your browser.

- Let's go deeper and slice and dice our chart! Add the
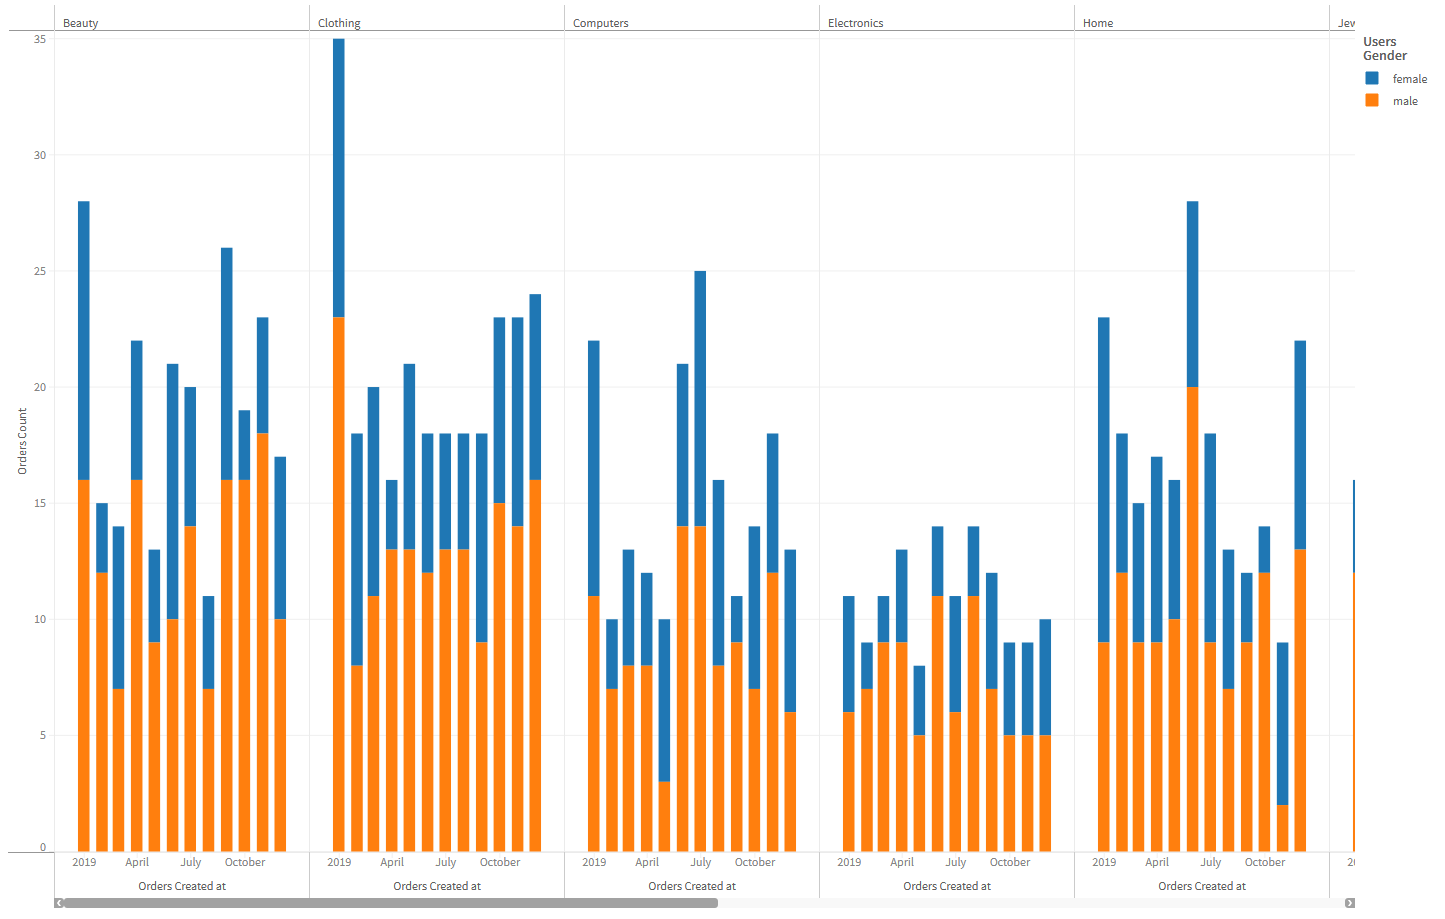
ProductCategories.namefield to theCanvascomponent'scolumnsprop.
Save the file and you should see the single chart now split into a number of columns where each column shows the monthly number of orders colored by gender for every product category!
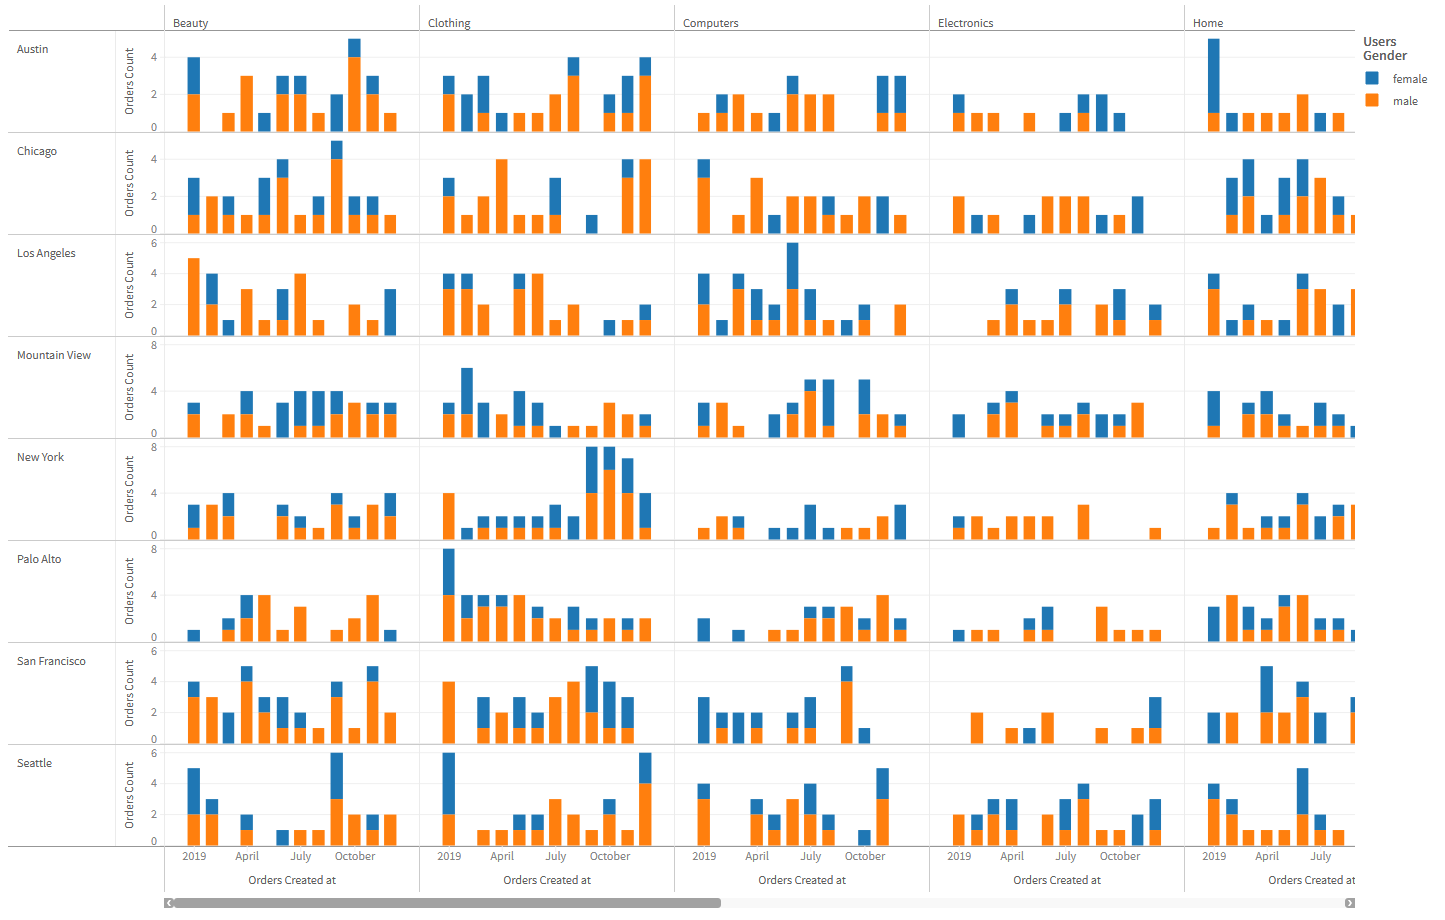
- Now lets slice some rows! Add the
Users.cityfield to theCanvascomponent'srowsprop.
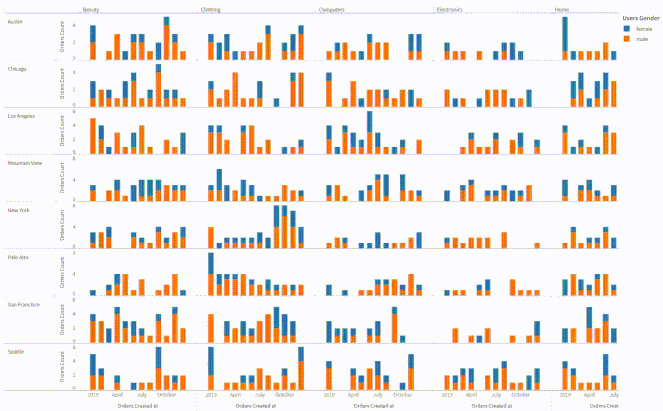
Save the file and you should see the visualization below. We've finally achieved what we set out to do: visualize the split between the quantity of orders placed every month by our male and female customers across all products categories in every city for the year 2019!
Go ahead! Click on the legend items! Click and drag to select some plots in one cell of the visualization! Everything is cross-connected!
The explanation above may have made it look like the code was too long. But its actually just about 90 lines of code (at a per line character limit of 80). Check it out below!
And with just that, we get a beautifully faceted, cross-interactive visualization!
J. Conclusion
Whew! That was a long one. And we learned a lot! To recap we:
- installed PostgreSQL
- set it up with an authenticated user with only the necessary database permissions
- loaded some data into it
- created a Cube back-end project
- generated the Cube schema for our database
- created a React based front-end project
- connected the back-end and the front-end
- brought data from the database to the front end by querying data using Cube
- created a DataModel
- rendered a simple chart using MuzeJS and React
- sliced and diced the chart it till we could visualize our exploratory question
That's all folks! There's a ton more features that MuzeJS has and the possibilities open up even more when combined with Cube. You can check MuzeJS here and its many hand crafted demos showing its many features here. As mentioned at the start of the article we'll keep this article updated with links to posts about more cool stuff possible with MuzeJS and Cube. Keep an eye out!
We hope you found this article helpful! If you have any feedback or queries feel free to send an email to eng@charts.com. We'll get back to you quick!