Giving mobile users access to analytical data is always a hard problem to solve. Browsing a heavy website on a small screen usually is not the best user experience. Building native mobile apps is a great solution, but usually requires a lot of effort.
React-Native makes building and maintaining native applications much easier. By coupling it with Cube and Victory-Native, I'll show you how to build an analytics dashboard embedded into a native mobile app. The resulting app can run both on iOS and Android; you can try it out by using the Expo app on your own device.
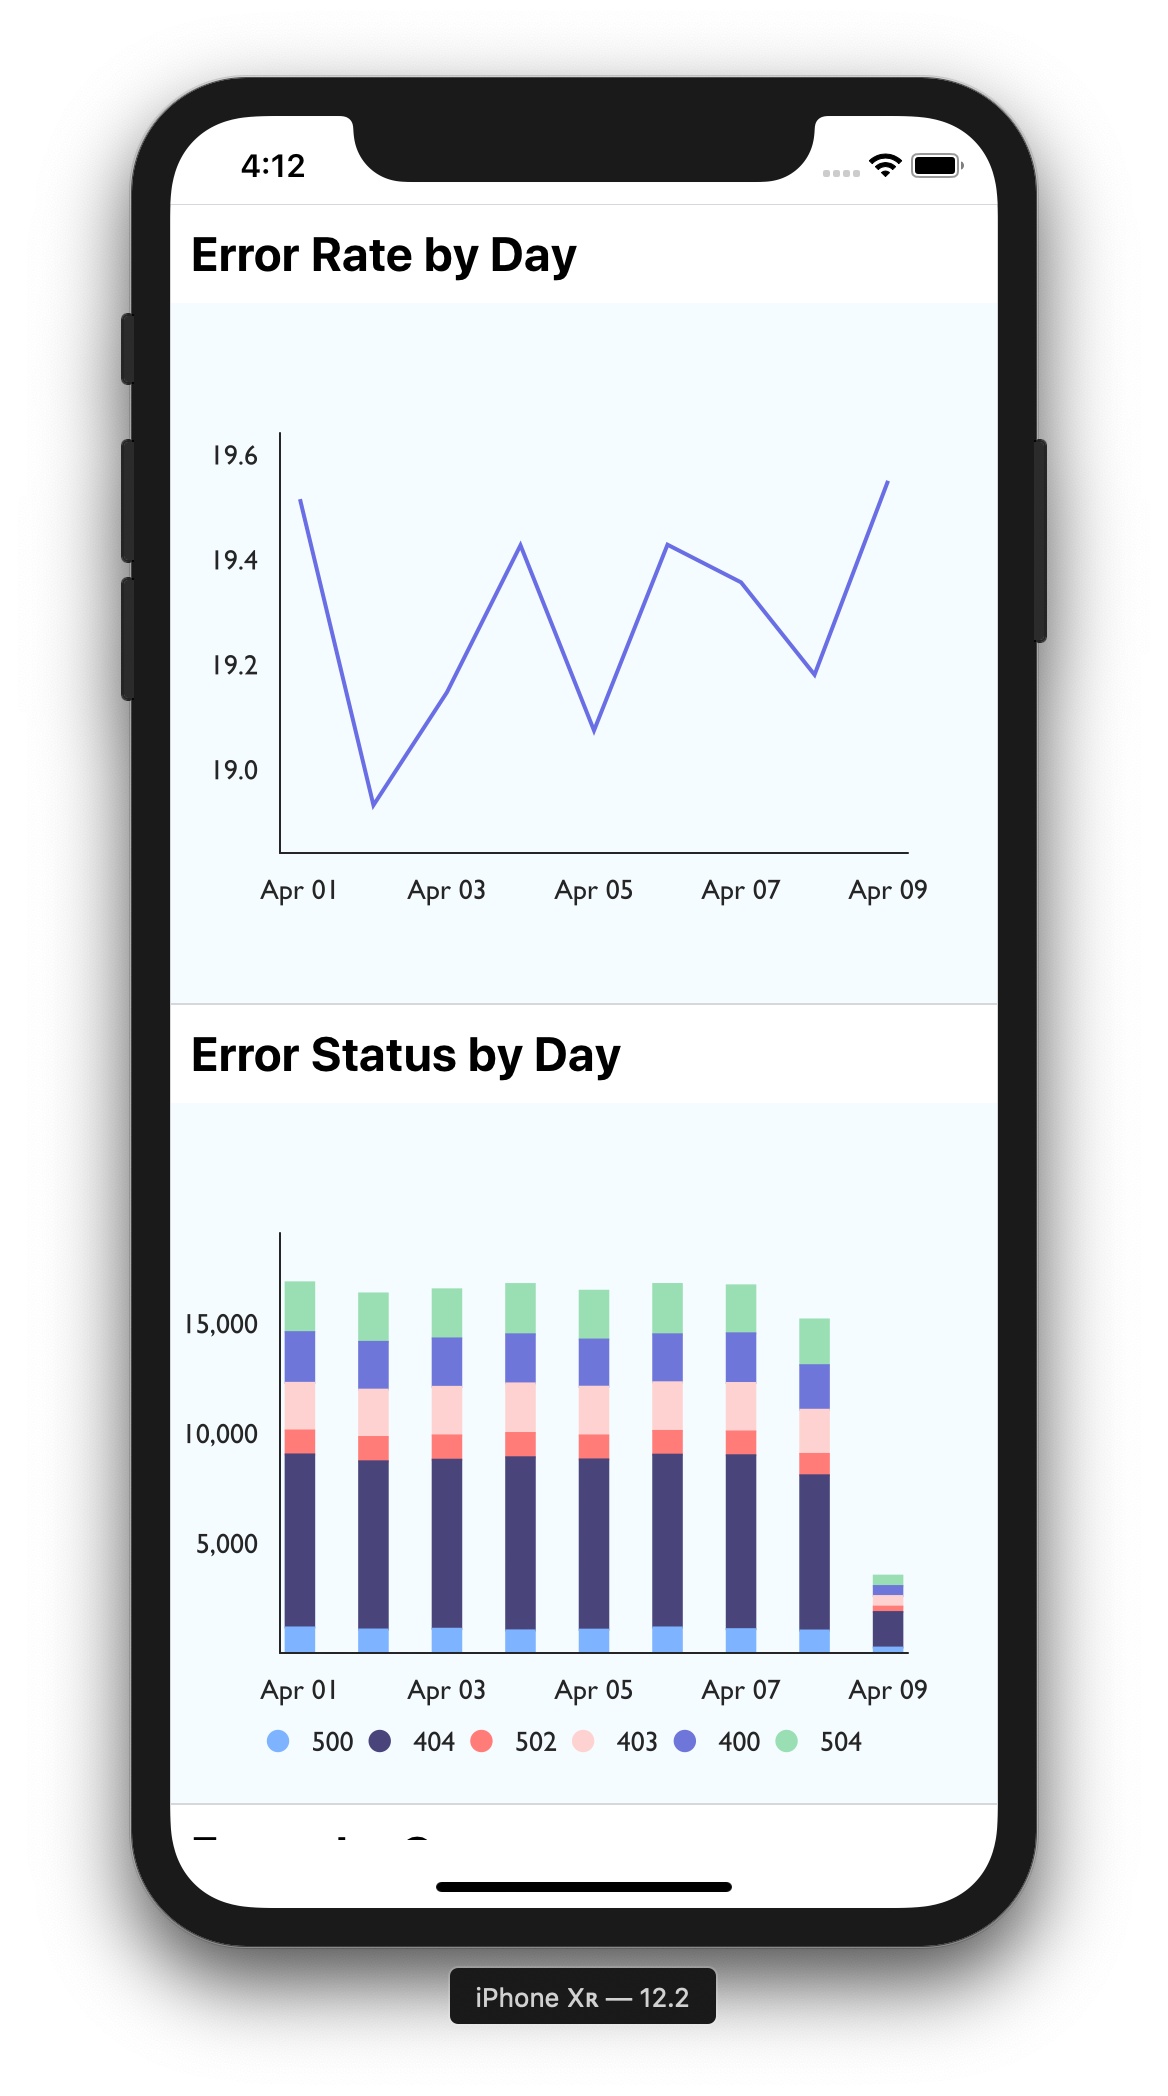
Below is a screenshot of the final app. Here's the app snack on Expo—you can run it online or launch it on your device. Also, there you can find all the source code from this tutorial.
The data
We are going to use the Cube backend with sample data from Nginx logs. I’ve covered how to collect Nginx logs and analyze them with AWS Athena and Cube in this tutorial.
Let’s recap the data schema we’re going to query:
cube(`Logs`,{
measures:{
count:{
type:`count`,
},
errorCount:{
type:`count`,
filters:[
{sql:`${CUBE.isError} = 'Yes'`}
]
},
errorRate:{
type:`number`,
sql:`100.0 * ${errorCount} / ${count}`,
format:`percent`
}
},
dimensions:{
status:{
sql:`status`,
type:`number`
},
isError:{
type:`string`,
case:{
when:[{
sql:`${CUBE}.status >= 400`,label:`Yes`
}],
else:{label:`No`}
}
},
createdAt:{
sql:`from_unixtime(created_at)`,
type:`time`
}
}
});
Cube uses data schemas like the one above to generate SQL and execute it against your database. If you are new to Cube, I recommend checking this Cube 101 tutorial.
React-Native
To build a react-native app, we'll be using the react-native-cli package.
Go ahead and install it:
npm install -g react-native-cli
# or
yarn global add react-native-cli
Now you can create a new app:
react-native init cubejs-rn-demo
cd cubejs-rn-demo
This will create a barebones react-native app.
Cube
Cube provides a client package for loading data from the backend:
npm install -s @cubejs-client/core
# or
yarn add @cubejs-client/core
It works for both web and native apps. Also, Cube has a React component, which is easier to work with:
npm install -s @cubejs-client/react
# or
yarn add @cubejs-client/react
The Cube React client also works great with React-Native. The client itself doesn't provide any visualisations and is designed to work with existing chart libraries. It provides a set of methods to access Cube API and to work with query result.
Victory
For charts, we will be using the victory-native library.
npm install -s victory-native
# or
yarn add victory-native
Now we can create a simple pie chart just like on the demo dashboard. Here's the code:
We are going to build a simple dashboard with just a couple of tiles, so we'll use a ScrollView. If you're going to have many tiles on a dashboard, it would be better to switch to a FlatList because of potential performance issues. So, let's create a simple dashboard. First, we are going to create a Chart component, where we'll define all required data.
constEmpty=()=><Text>No component for that yet</Text>;
Also, we will be using Victory's zoomContainer to allow users to zoom into the data. We'll also save current device orientation to add more data in landscape mode and change paddings:
Please note that the default app.json config has locked portrait screen orientation. To allow device rotation, set "orientation" to "default"—that will allow all orientations except upside down. This code scales the charts when the device is rotated:
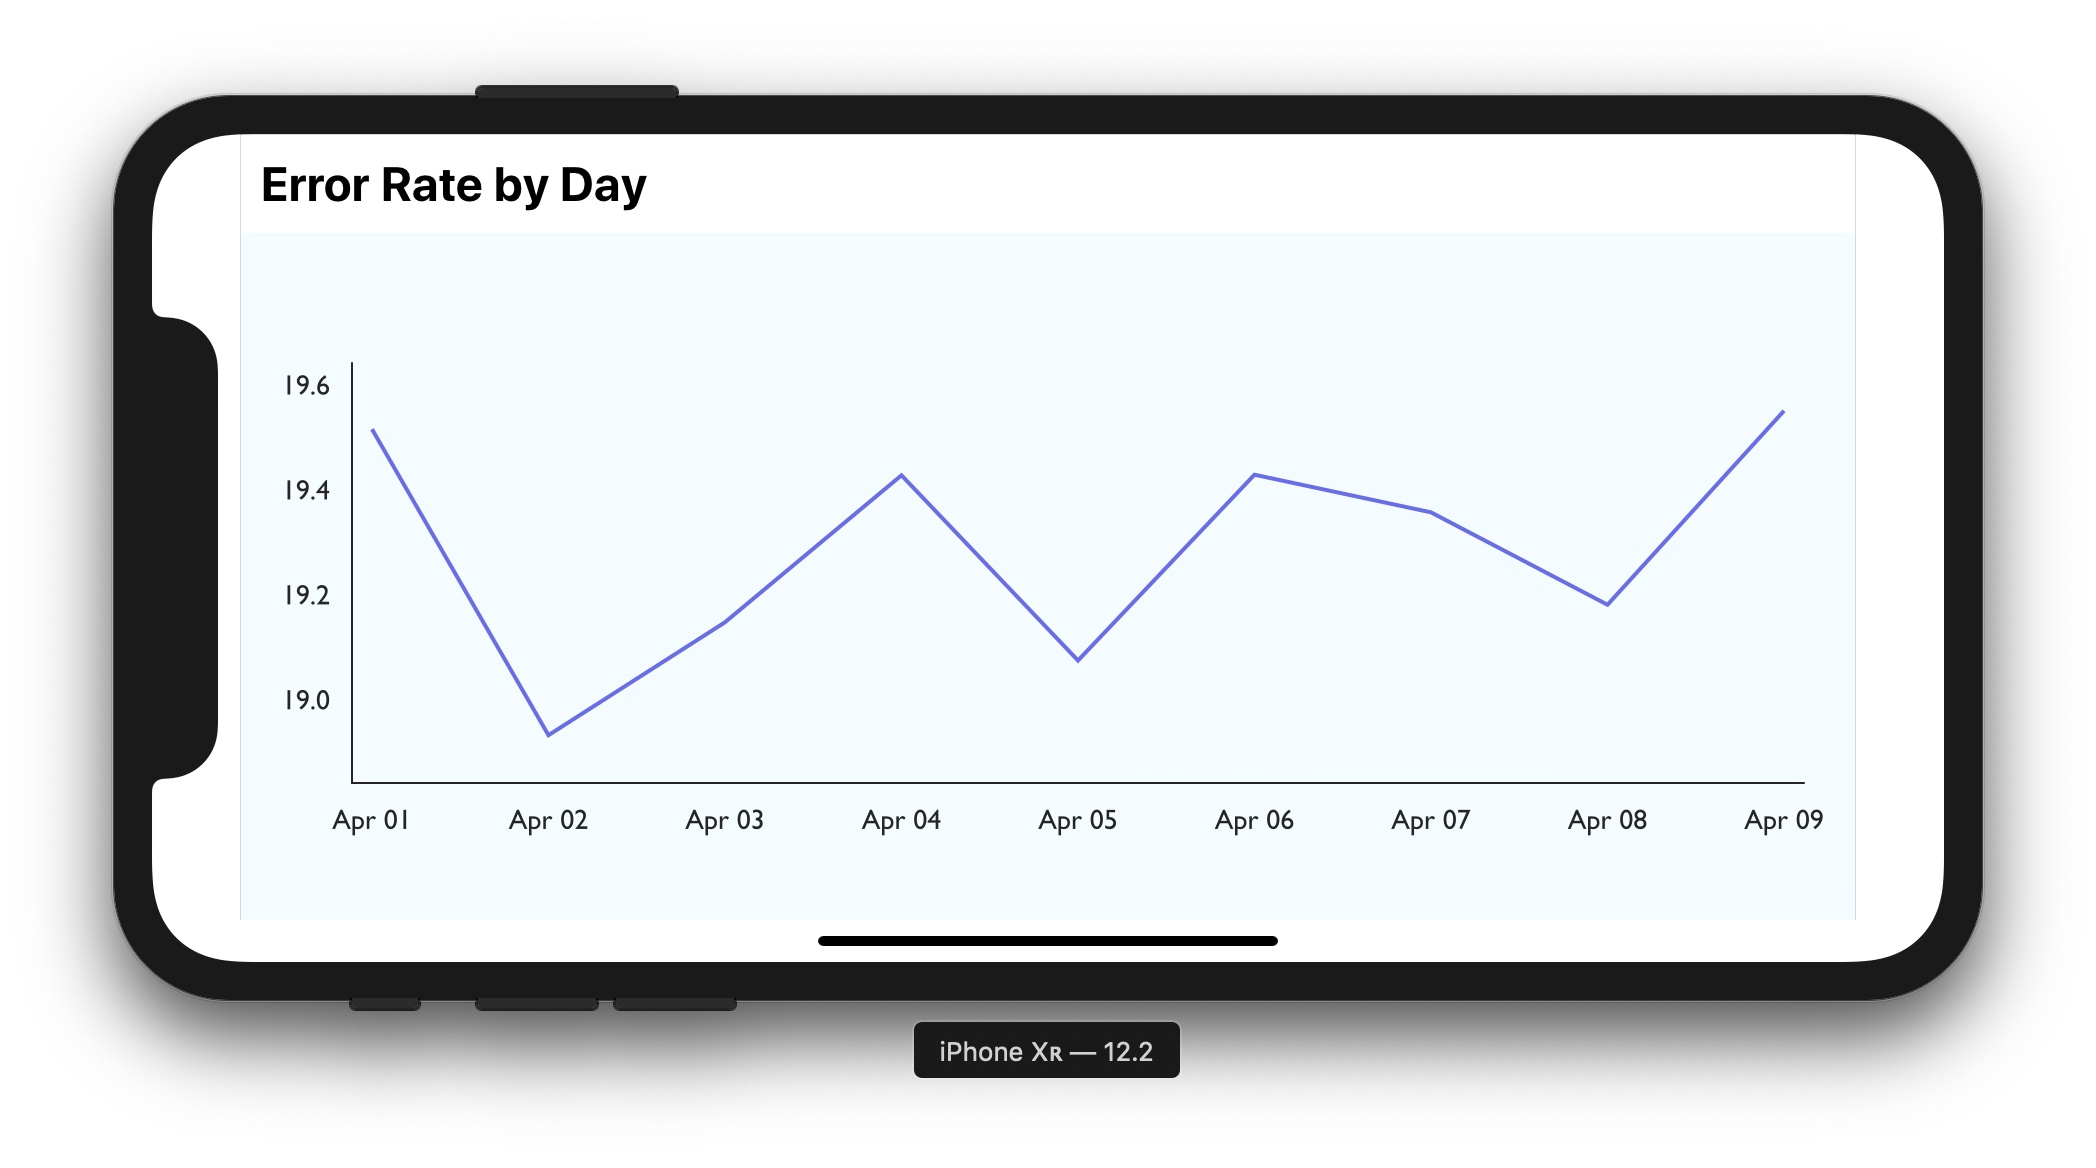
Let's start with a line chart. First, we'll need to define a basic Cube query in Chart to get the data:
{
measures:["Logs.errorRate"],
timeDimensions:[
{
dimension:"Logs.createdAt",
dateRange:["2019-04-01","2019-04-09"],
granularity:"day"
}
]
}
Now we can create a LineChart component. It's a basic Victory chart with a bit of styling:
constLineChart=({ data })=>(
<ChartWrapper>
<VictoryLine
data={data.chartPivot()}
x={dateFormatter}
labels={null}
y={data.seriesNames()[0].key}
style={{
data:{stroke:"#6a6ee5"},
parent:{border:"1px solid #ccc"}
}}
/>
</ChartWrapper>
);
We can include this component in the Chart file and render in the Dashboard.js screen:
constDashboard=()=>{
return(
<ScrollView>
<View style={styles.item}>
<Text style={styles.text}>ErrorRate by Day</Text>
<Chart type="line"/>
</View>
</ScrollView>
);
};
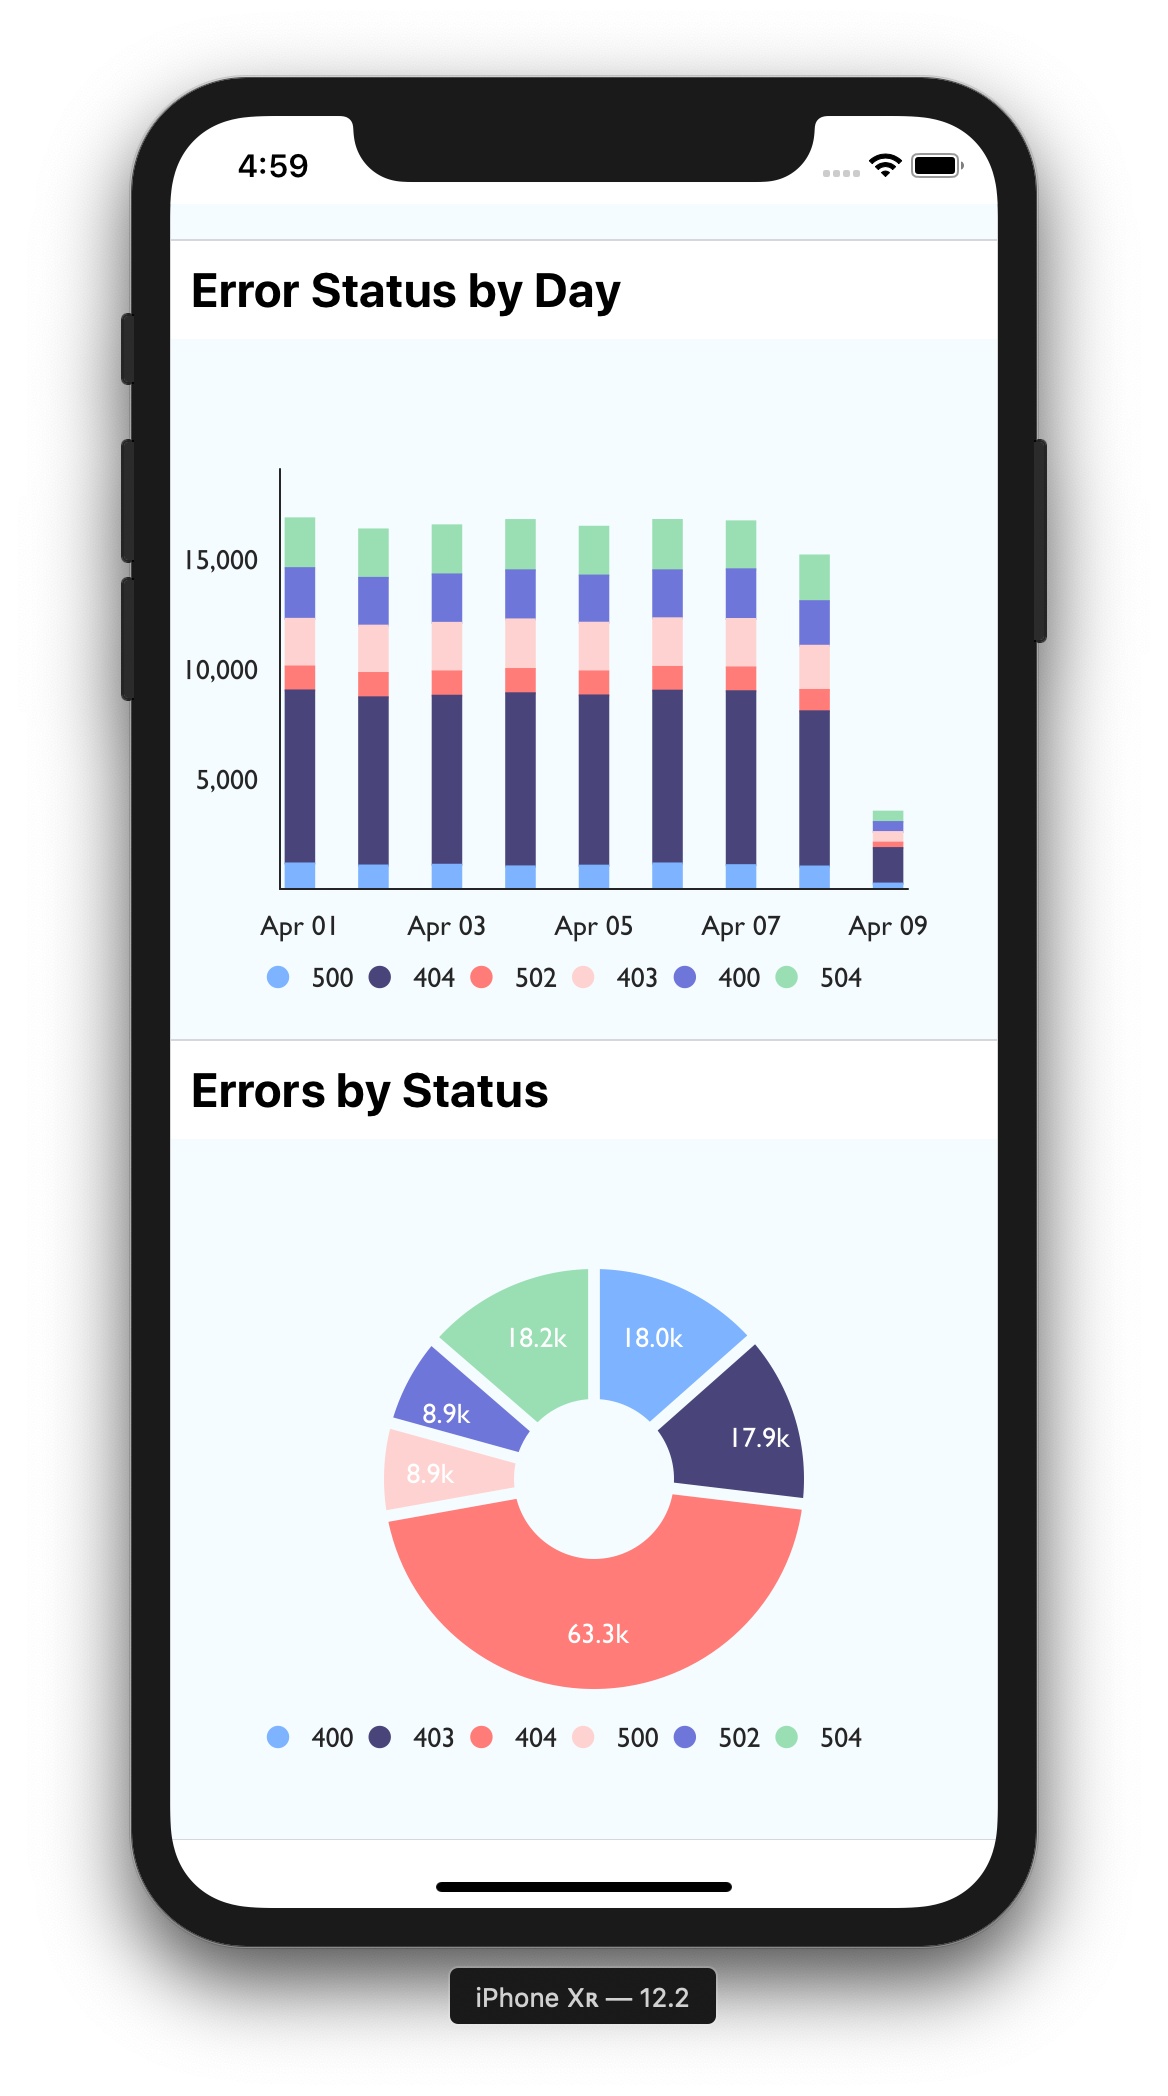
The same applies to Stacked Bar Chart. The only complication is that it consists of multiple series, so we add a bar for each series and make a legend:
constBarChart=({ data })=>(
<ChartWrapper>
<VictoryStack colorScale={colors}>
{data.seriesNames().map((series, i)=>(
<VictoryBar
key={i}
x={dateFormatter}
y={series.key.replace(":",", ")}
data={data.chartPivot()}
labels={null}
style={{
parent:{border:"1px solid #ccc"}
}}
/>
))}
</VictoryStack>
<VictoryLegend x={40} y={280}
orientation="horizontal"
colorScale={colors}
data={data.seriesNames().map(({ title })=>({name: title.substring(0,3)}))}
/>
</ChartWrapper>
);
Now we come to the pie chart. There's a trick to hide the axis—we add an empty VictoryAxis here:
data={data.chartPivot().map(({ x })=>({name: x }))}
/>
</ChartWrapper>
);
Here's a screenshot of the pie chart on the dashboard:
And our dashboard is done! You can find all the code and the app on Expo. You can run this app online or launch it on your device via the Expo app. It will work relatively slow as it's not compiled with platform-specific native code, but you can always download the source code and build a native app for your platform via Xcode or Android Studio.