
Sometimes in our daily data visualization, we need to merge several similar data sources so that we can manipulate everything as one solid bunch of data.
For example, we may have an omnichannel shop where online and offline sales are stored in two tables. Or, we may have similar data sources that have only a single common dimension: time. How can we calculate summary metrics for a period? Joining by time is the wrong way because we can’t apply granularity to get the summary data correctly.
Furthermore, how can we find seasonal patterns from summarized metrics? And how can we get and process data synchronously to track correlations between channels?
Well, the new data blending functionality in version 0.20.0 of Cube.js takes care of all these cases.
If you’re not familiar with Cube.js yet, please have a look at this guide. It will show you how to set up the database, start a Cube.js server, and get information about data schemes and analytical cubes.
Please, keep in mind that we used here another dataset:
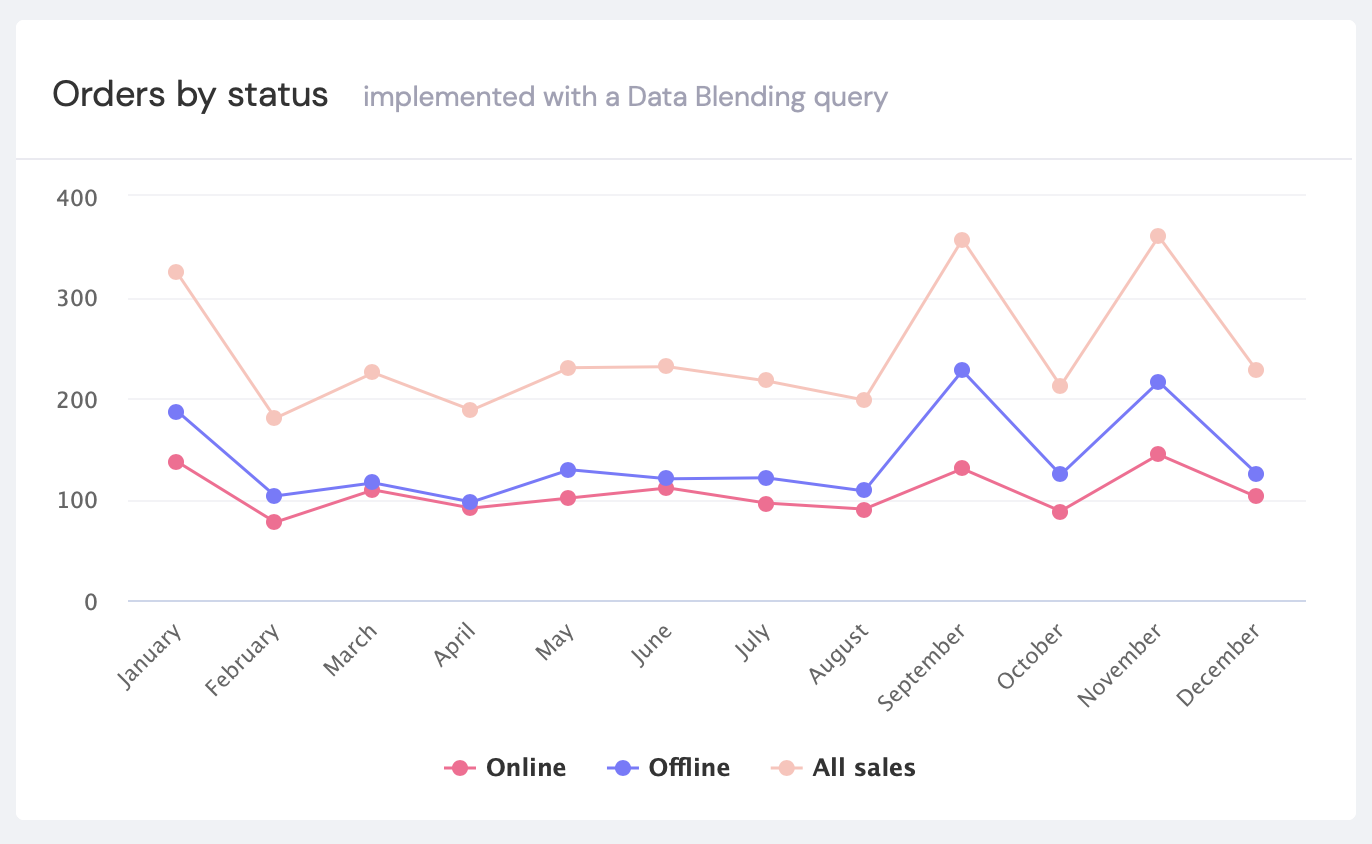
Now let’s dive into the metrics for an example shop and visualize sales by channel and as a summary.
Here is the full source and live demo of the example.
I used React to implement this example, but querying in Cube.js works the same way as in Angular, Vue, and vanilla JS.
Our schema has two cubes:
Orders.js
and OrdersOffline.js
The existence of at least one-time dimension in each cube is a core requirement for merging the data properly. In other words, the data are suitable for blending only if you can present the data on a timeline. Sales statistics or two lists of users that both have an account created date are appropriate datasets for data blending. However, two lists of countries with only a population value can’t be united this way.
A Special Query Format for Data Blending
A simple and minimalistic approach is to apply data blending to a query object when we retrieve data from our frontend application. The schema and backend don’t need to be changed.
The blended data is an array of query objects, so we just combine regular Cube.js query objects into an array with a defined dateRange and granularity.
As a result, Cube.js returns an array of regular resultSet objects.
But what if we want to do calculations over blended data sources or create custom metrics? For example, how can we define ratios calculated using data from two sources? How can we apply formulas that depend on data from multiple sources?
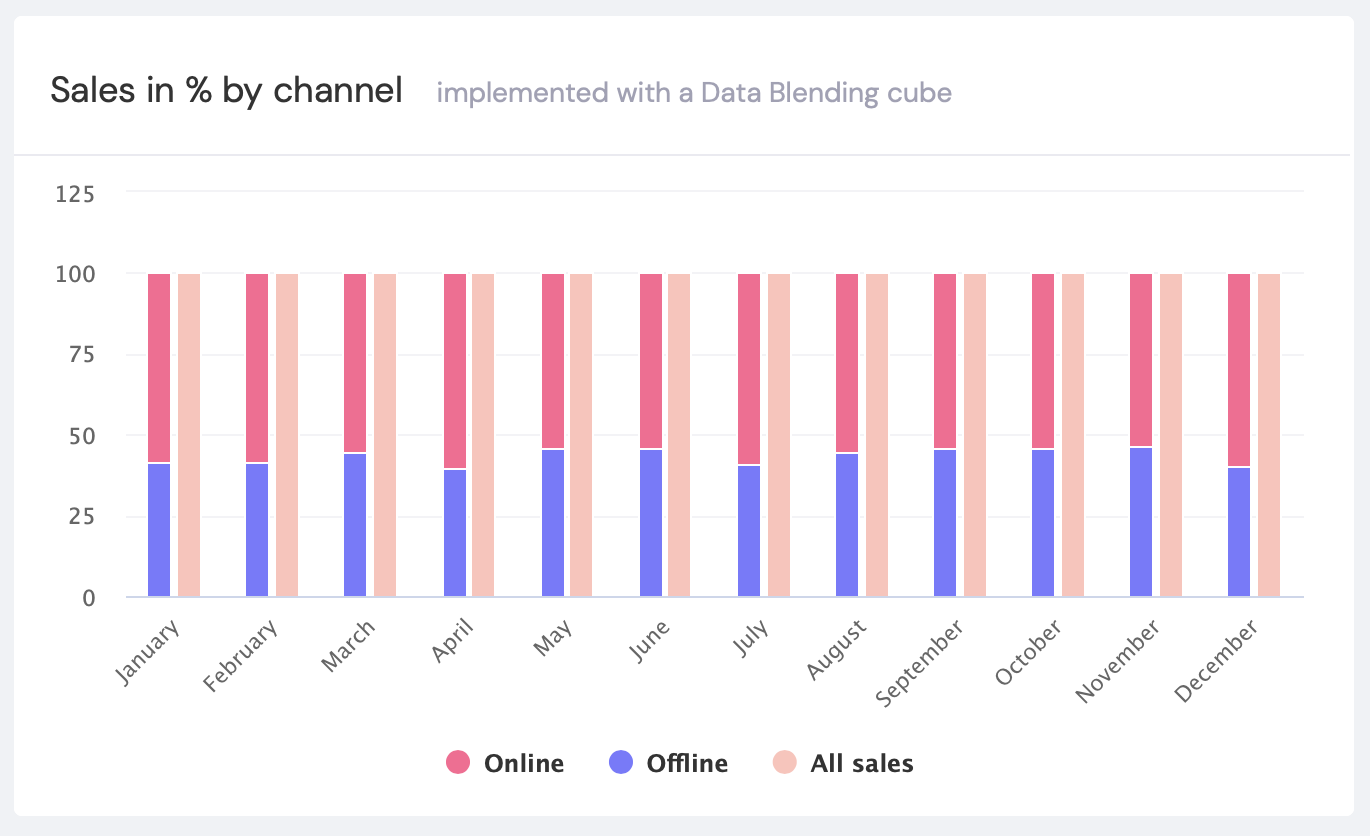
In this case, we can use another data blending function. We start by setting up a new cube.
Data Blending Implementation within a Schema
Let’s create AllSales.js inside the schema folder:
Here we’ve applied a UNION statement to blend data from two tables, but it’s possible to combine even more.
Using this approach, we can easily define and combine values from several blended data sources. We can even use calculated values and SQL formulas.
We can retrieve data from frontend applications and process the results in the usual way:
Conclusion
If we need to visualize data from several sources and apply time granularity to the data, then with data blending, we need to write less code and we can simplify the application logic.
We looked at two ways to implement data blending: We retrieved data as an array of query objects from a frontend application. This is simple to do and the schema doesn’t need to be modified. We can even merge data from several databases. Furthermore, we can retrieve and process independent data synchronously so that we can visualize it on a timeline. We blended data by defining a special cube in a schema. This approach allows us to apply aggregate functions to all sources simultaneously and we can define calculated values.
We hope this tutorial will help you to write less code and help to build more creative visualizations. If you have any questions or feedback or you want to share your projects, please use our Slack channel or mention us at Twitter.
Also, don’t forget to sign up for our monthly newsletter to get more information about Cube.js updates and releases.