
Comparing a single metric over different time periods is a quite common procedure in data analytics. You can evaluate your company’s performance by comparing this year’s revenue with the previous year’s. You can understand which are the low and high sales months in your market, and furthermore, you can predict customer behavior and figure out seasonal patterns.
Analytical systems like Google Analytics, Youtube Studio, and others provide tools for comparing a single metric over different periods of time.

Let’s see how you can implement such analytical visualization with Cube.js.
Here you can see the live demo and the full source code for this example.
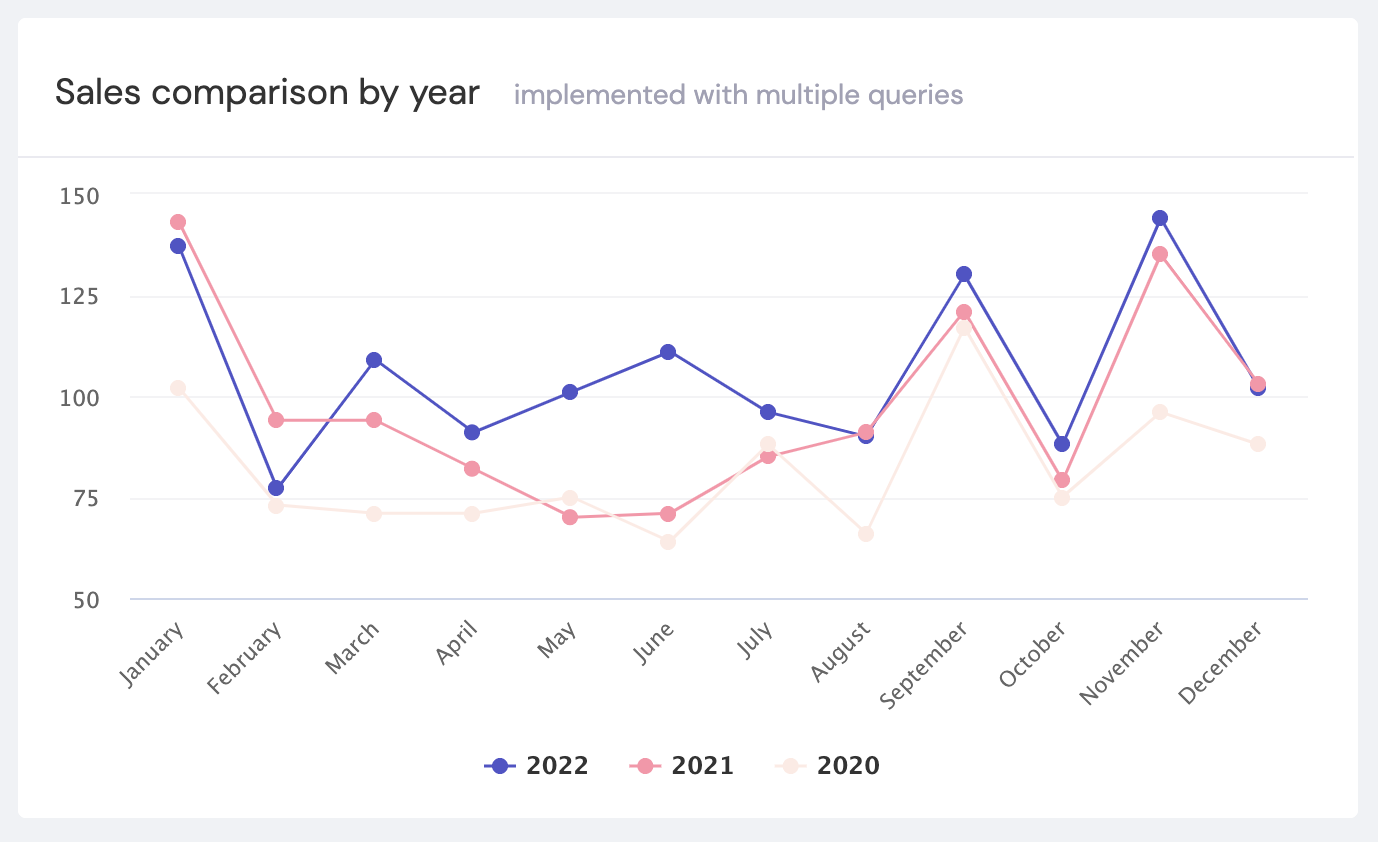
We will explore a sample e-commerce dataset and compare the numbers of orders in the three most recent years. To do this, we need to run a Cube.js server and a simple dashboard application.
If you’re not yet familiar with Cube.js, please follow our guide to setting up the database, starting a Cube.js server, and getting information about data schemes and analytical cubes.
Now, let’s create the Orders cube inside the schema folder with the following code:
Here the count measure is used to calculate the number of orders. The createdAt field is used to retrieve an order’s timestamp.
In the next sections, we will implement the example with React, but you can use the same approach with Vue, Angular, and vanilla JS.
Multiple Queries for a Single Chart
Here’s how we retrieve the data for each year and parse result sets into the format that is accepted by our charting library:
Once the data is prepared, we send it to the <Line /> rendering component and, behold, we create an informative chart:
The procedure is quite simple, isn’t it? However, as you can see, the code is a little bit messy and repetitive. More importantly, it’s not easy to adapt the code to a different amount of years or even to adjust it dynamically in response to users’ actions or application states.
How do we solve this problem? Let’s try another approach.
A Single Query for a Single Chart
With the 0.20.0 release of Cube.js, it’s possible to retrieve data for different time periods using a single query.
The compareDateRange property accepts an array of two or more different time periods and returns data for all of them in one request.
We can rewrite our previous code in a simpler way:
You can see that this code is much shorter. Furthermore, now we’re able to set the time periods via compareDateRange dynamically while keeping our code clean.
Please note that we didn’t make any changes in the <Line /> rendering component, so the chart will look essentially the same.
I hope that this will help you create useful data visualizations using substantially less code.
Also, don’t forget to sign up for our monthly newsletter to get more information about Cube.js updates and releases.