
This is the second part of a tutorial series on building an analytical web application with Cube.js. You can find the first part here. It expects the reader to be familiar with Javascript, Node.js, React, and have basic knowledge of SQL. The final source code is available here and the live demo is here. The example app is serverless and running on AWS Lambda. It displays data about its own usage.
In this part, we are going to add Funnel Analysis to our application. Funnel Analysis, alongside with Retention Analysis, is vital to analyze behavior across the customer journey. A funnel is a series of events that a user goes through within the app, such as completing an onboarding flow. A user is considered converted through a step in the funnel if she performs the event in the specified order. Calculating how many unique users made each event could show you a conversion rate between each step. It helps you to localize a problem down to a certain stage.
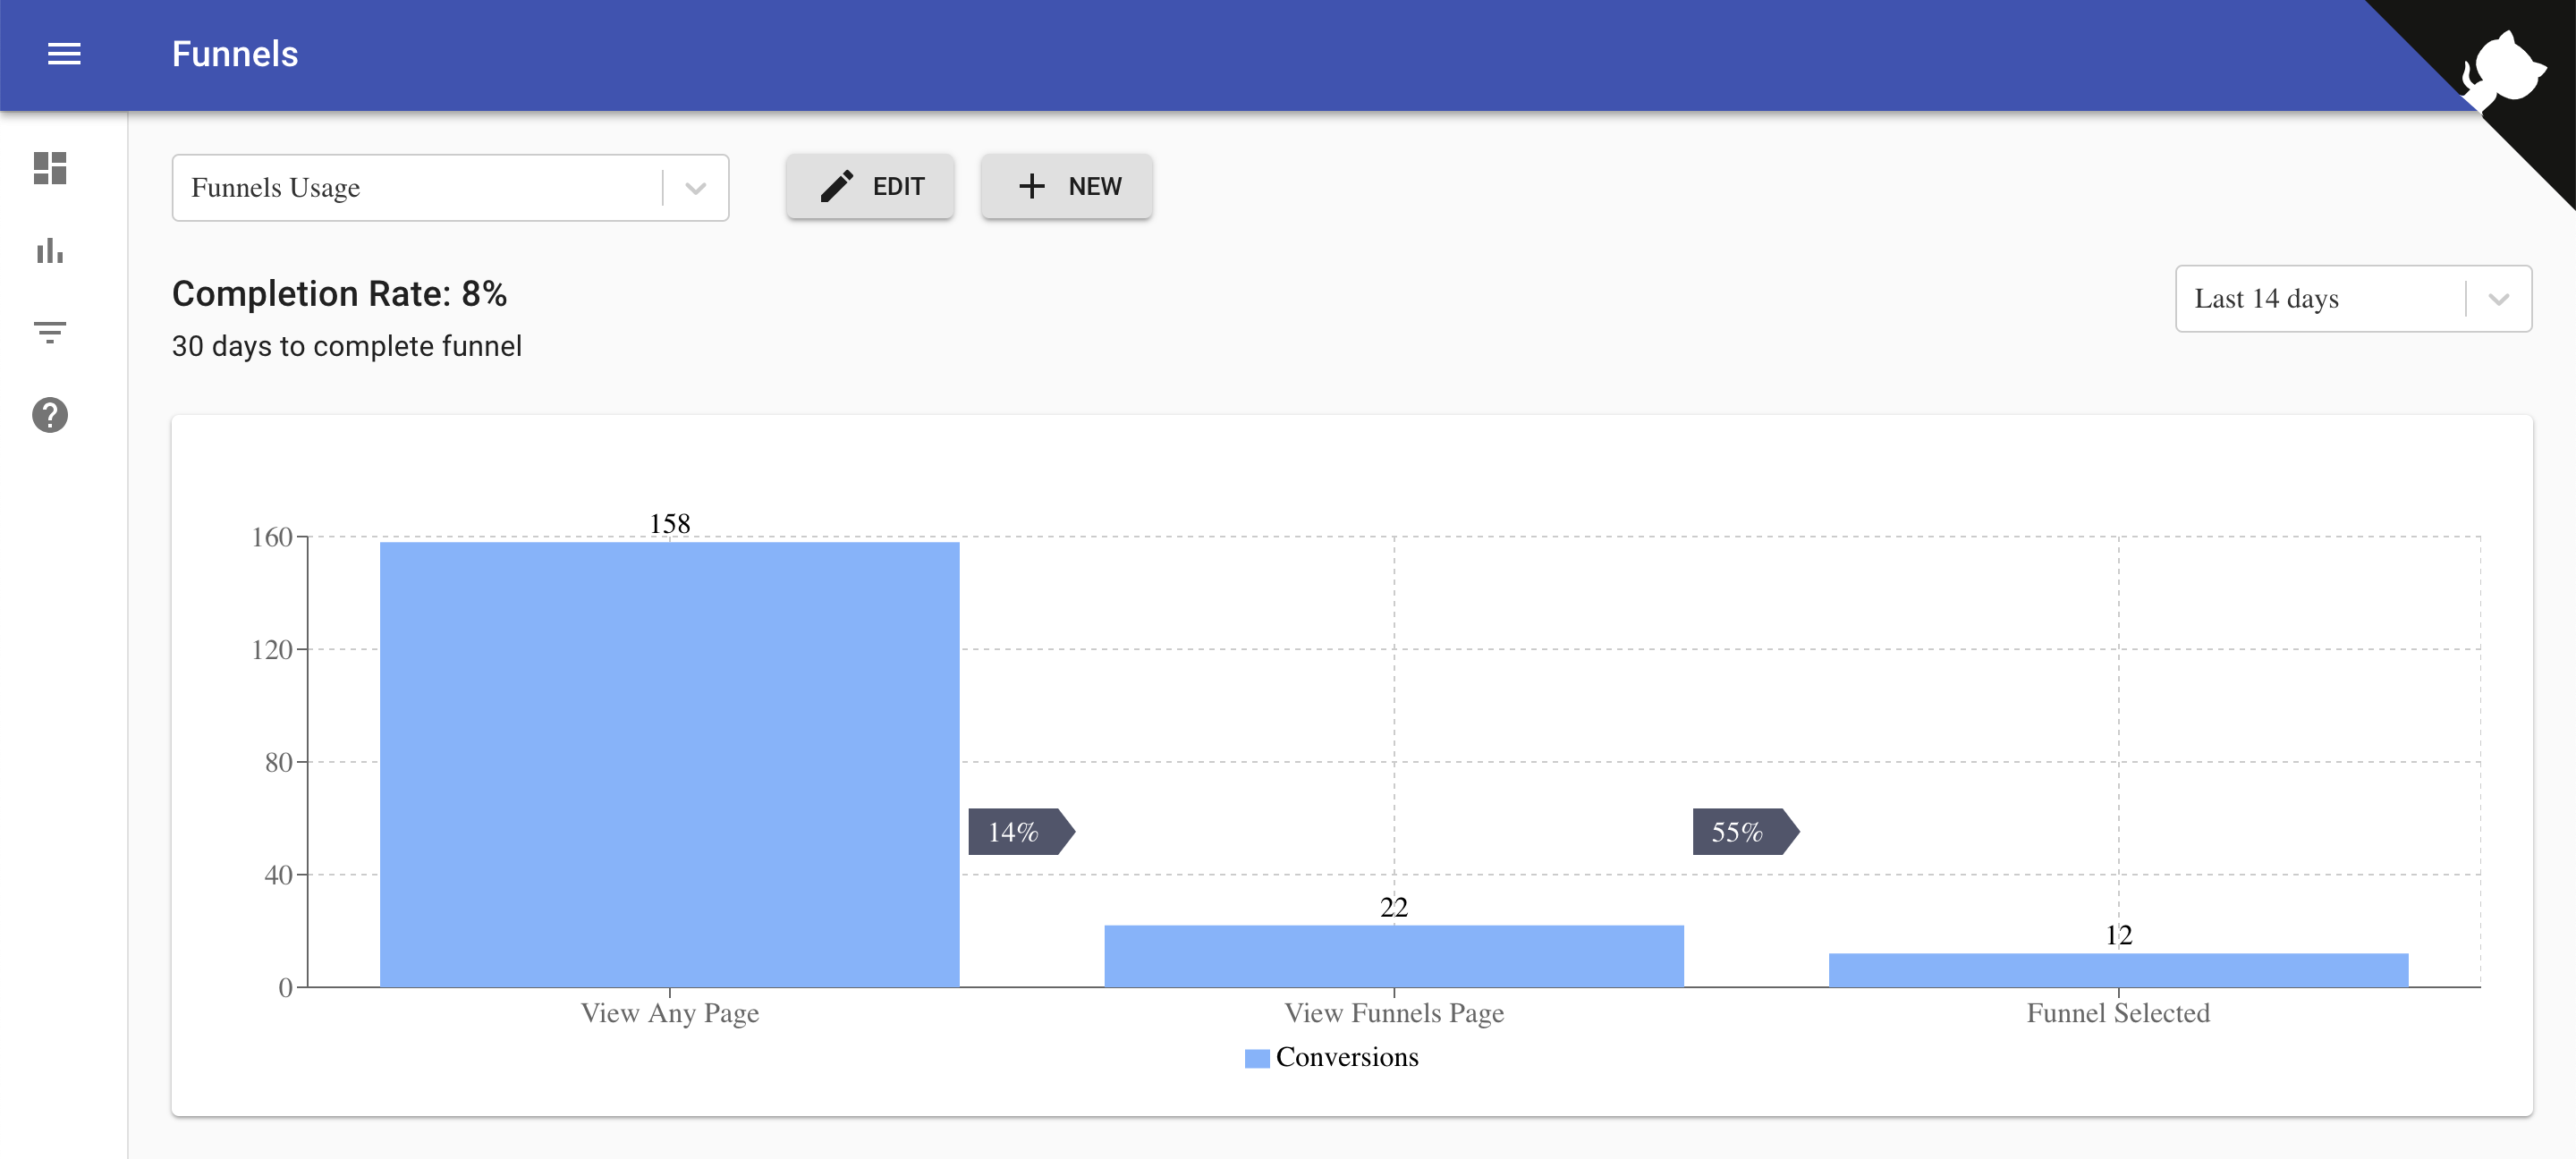
Since our application tracks its own usage, we'll build funnels to show how well users navigate through the funnels usage. Quite meta, right?
Here’s how it looks. You check the live demo here.
Building SQL for Funnels
Just a quick recap of part I—we are collecting data with the Snowplow tracker, storing it in S3, and querying with Athena and Cube.js. Athena is built on Presto, and supports standard SQL. So to build a funnel, we need to write a SQL code. Real-world funnel SQL could be quite complex and slow from a performance perspective. Since we are using Cube.js to organize data schema and generate SQL, we can solve both of these problems.
Cube.js allows the building of packages, which are a collection of reusable data schemas. Some of them are specific for datasets, such as the Stripe Package. Others provide helpful macros for common data transformations. And one of them we're going to use—the Funnels package.
If you are new to Cube.js Data Schema, I strongly recommend you check this or that tutorial first and then come back to learn about the funnels package.
The best way to organize funnels is to create a separate cube for each funnel. We'll use eventFunnel from the Funnel package. All we need to do is to pass an object with the required properties to the eventFunnel function.
Check the Funnels package documentation for detailed information about its configuration.
Here is how this config could look. In production applications, you're most likely going to generate Cubes.js schema dynamically. You can read more about how to do it here.
The above, 3-step funnel, describes the user flow from viewing any page, such as the home page, to going to Funnels and then eventually selecting a funnel from the dropdown. We're setting timeToConvert to 30 days for the 2nd and 3rd steps. This means we give a user a 30 day window to let her complete the target action to make it to the funnel.
In our example app, we generate these configs dynamically. You can check the code on Github here.
Materialize Funnels SQL with Pre-Aggregations
As I mentioned before, there is a built-in way in Cube.js to accelerate queries’ performance.
Cube.js can materialize query results in a table. It keeps them up to date and queries them instead of raw data. Pre-Aggregations can be quite complex, including multi-stage and dependency management. But for our case, the simplest originalSql pre-aggregation should be enough. It materializes the base SQL for the cube.
Learn more about pre-aggregations here.
Visualize
There are a lot of way to visualize a funnel. Cube.js is visualization-agnostic, so pick one that works for you and fits well into your app design. In our example app, we use a bar chart from the Recharts library.
The Funnels package generates a cube with conversions and conversionsPercent measures, and steps and time dimensions. To build a bar chart funnel, we need to query the conversions measure grouped by the step dimension. The time dimension should be used in the filter to allow users to select a specific date range of the funnel.
Here is the code (we are using React and the Cube.js React Client):
If you run this code in CodeSandbox, you should see something like this.
The above example is connected to the Cube.js backend from our event analytics app.
In the next part, we’ll walk through how to build a dashboard and dynamic query builder, like one in Mixpanel or Amplitude. Part 4 will cover the Retention Analysis. In the final part, we will discuss how to deploy the whole application in the serverless mode to AWS Lambda.
You can check out the full source code of the application here.