
I like counting stars. Especially stars on GitHub! Tracking the growth of popular GitHub repositories has always been interesting to me. That's why I decided to use the public data set of GitHub events in ClickHouse to create dashboards with actionable metrics.
In this tutorial, I'll explain how to build a custom front-end visualization that fetches data from a ClickHouse instance. I'll use a managed instance of ClickHouse from Altinity Cloud and Cube Cloud as the metrics API layer.
If you would like to use a low-code solution like Apache Superset, check out this article by my co-worker Igor!
Here's what the metrics dashboard app will look like once I'm done. You can also look at a live preview.

How I'll Build a ClickHouse Visualization
I want to use the public GitHub Events dataset that represents data from all events that are generated by GitHub since 2011. This data has more than 3 billion elements. Pretty massive, isn't it?
To handle all this data, I want to use ClickHouse. It's a powerhouse of a database for building analytics apps. ClickHouse is also often used for metrics storage. Most commonly in conjunction with other databases to materialize views for metrics.
However, I don't want to waste time and my own nerves on running the infra myself. I'm a developer, why should I? I'd much rather have a managed ClickHouse instance configured by professionals. Altinity fits my needs perfectly. I get a managed service for ClickHouse with all the features I need without worrying about scaling the infrastructure.
Even though ClickHouse is lightning-quick, I still need an API to consume the data and display it on metrics dashboards. I'll use Cube Cloud as the metrics layer to generate queries for my analytics. Cube is an analytics API for building data apps.
With all that out of the way, let me explain my reasoning behind my decisions.
What is ClickHouse?
ClickHouse is a fast open-source column-oriented database management system that allows generating analytical data reports in real-time using SQL queries.
It uses a columnar storage engine that enables it to have high performance for analytical queries. The success of ClickHouse and the huge adoption have led to a $250 million series-B investment.
ClickHouse delivers high query processing speed and data storage efficiency. It's capable of processing more than 100 PBs of data with more than 100 billion records inserted every day.
There are a few different ways to run ClickHouse
- Locally or on bare-metal.
- Cloud providers like AWS, Google Cloud Platform, etc.
- Y.Cloud
- Altinity
The simplest solution I ultimately decided to use is Altinity. Let me explain why.
What is Altinity?
Altinity.Cloud is a fully managed service for ClickHouse by ClickHouse Enterprise Experts. It runs in the region where your apps are located, not the region that’s convenient for Altinity.
I can pick any AWS or GCP region and the folks over at Altinity will make it work for me. Active regions are available for immediate deployment. If I need a new region, I just ask and they make it available in a couple of days. Pretty awesome!
I can spin up clusters, connect, and start working right away. They provide vertical and horizontal scaling as well. High availability is also enabled by default, I get multi-AZ operation and automatic backup. I also get automatic upgrades without interrupting service. Lastly, monitoring is part of the package deal as well. Sweet deal in my book.
I can focus all my effort on creating value instead of managing infrastructure. 🎉
With all of that out of the way, let's jump into creating a ClickHouse cluster on Altinity.Cloud.
Set Up a ClickHouse Cluster on Altinity.Cloud
The signup process is simple. First, go to the test drive page on Altinity. Then, add your info and ask the Altinity team to spin up a ClickHouse cluster for you.

After waiting a while you'll get a dedicated cluster with your own sign-in credentials.

Go ahead and sign in with your credentials. You'll land on the clusters page.

The next step is to create a cluster. Click on the Launch Cluster button to open the Cluster Launch Wizard.

Select your preferred configuration and hit next.

Make sure to also configure the connection configuration.

The final step is to launch the cluster. You will get an overview of the estimated cluster cost before moving on to launching the cluster.

Once you hit Launch, you'll have to wait a bit for the cluster to spin up.

Once it is up-and-running, it'll look like this.

Sweet! I have a running cluster. Let's pop some data into it.
Import GitHub Events Data into Your ClickHouse Cluster
There are a few ways you can import the GitHub Events dataset. I suggest downloading the dataset directly into ClickHouse.
First, edit the profile for your user to enable the import. You'll need to set the max_http_get_redirects value to a high number. I decided to go with 1000 just to keep it safe.

To connect to the ClickHouse instance, install clickhouse-client and create a ./clickhouse-client.xml file with the configuration parameters from Altinity.
The parameters you need in order to use the clickhouse-client are:
- Host:
<team>.<company>.altinity.cloud - Port:
9440 - User:
admin- or the user you configured - Password:
***- the password used for the current user
The clickhouse-client.xml file should look like this:
In the same directory where you saved the clickhouse-client.xml file, run this command.
Once connected, create a foreign table that will read data from a URL.
Next, create the destination table and insert the data.
This will take a while. Roughly 200 GBs need to be imported. I suggest grabbing a coffee.
Run a simple select query to make sure the data is completely imported. You should see around 4 billion rows.
Nice, you have all the data imported. It should all be around 225.84 GB in total. You can check the cluster page to confirm.
If you want to play with the GitHub Events data without having to import your own dataset, you can use the Altinity demo cluster. The clickhouse-client.xml should look like this:
From here on out in this tutorial I'll continue using the Altinity demo cluster for all the examples.
Writing Analytical ClickHouse Queries in Altinity
Next up, time to write a few analytical queries. First, I want to know the top 10 starred repositories.
Writing complex queries like this one is not simple if you're a developer like me. Ideally, I'd want a tool to act as a metrics layer, so I can generate charts and graphs without having to write any SQL myself. I also wouldn't mind configuring role-based access rights and security as well.
Cube makes all of this easy. Let me show you.
Set Up a Cube App in Cube Cloud
With Cube, you get a centralized metrics layer with SQL generation, auto-scaling, and much more. I'm a developer, I'd love to get all my SQL generated for me!
Let me show you how to set up Cube Cloud. After signing up, create a deployment. Select the ClickHouse database integration.

Add the values from your ClickHouse database. The database in Altinity.Cloud will be named default.

Next, generate a schema from the github_events table.

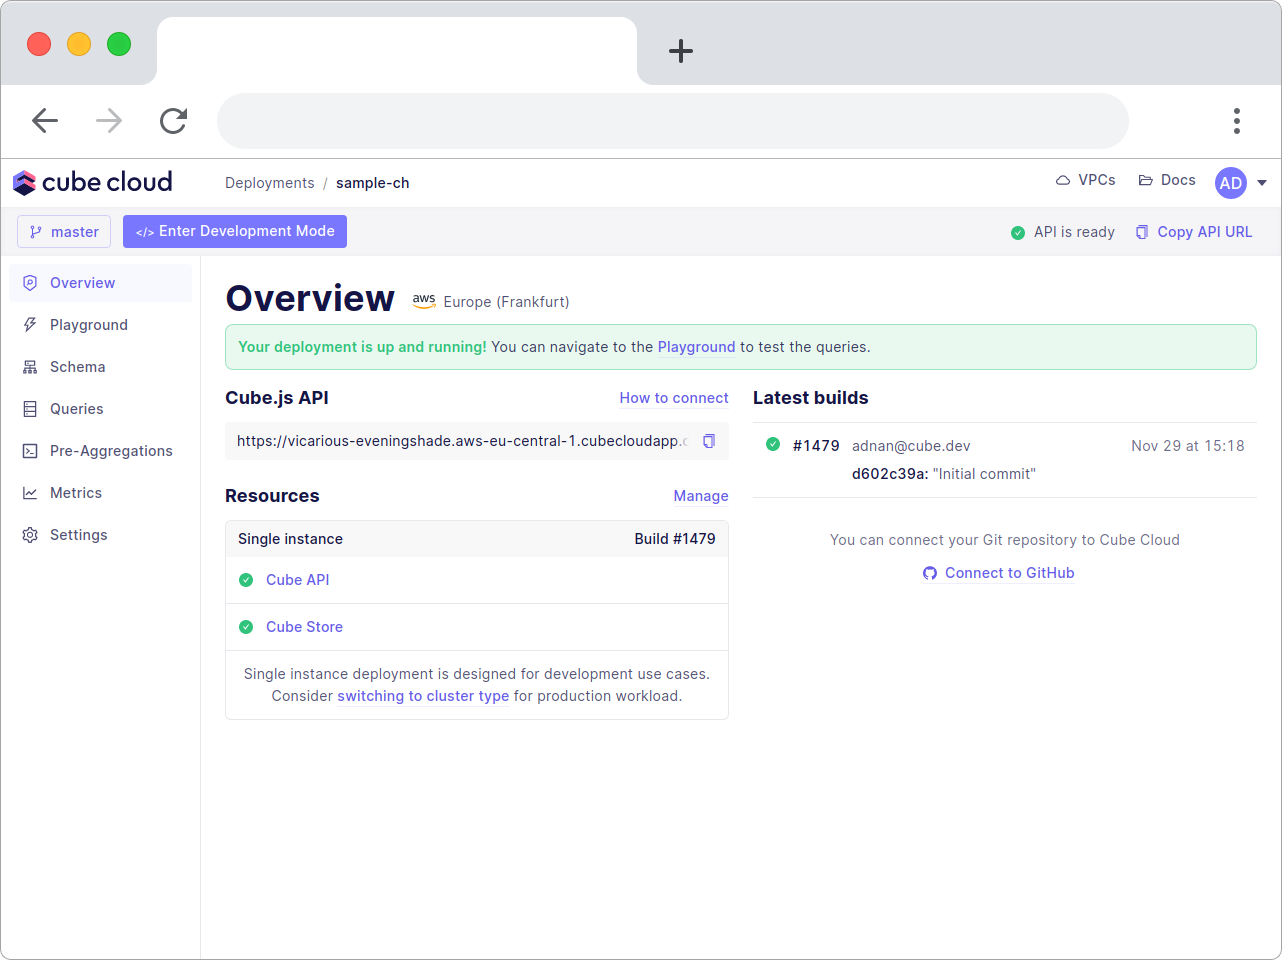
You don't need to generate the schema, but I suggest you do as it simplifies your life significantly. Once the deployment spins up, you get an overview of all resources.
Making Cube Cloud a Metrics Layer
Let's have a look at the autogenerated schema. Switch to the Schema tab and click the GithubEvents.js file.

I love starting with a base like this. From here it's easy to add more complex measures and dimensions to create your own custom metrics layer.
Let me start by showing you how to add a new dimension. Let's call it eventType.
In the GithubEvents.js it will look like this after adding the dimension.

After you save and commit this change, open up the playground and run the same query as you ran in Altinity directly.

Awesome! However, writing this complex filter is cumbersome. Let's add a segment instead.
Paste it just below the joins section.

This will give you a predefined filter so you don't have to fiddle around with defining filters in the Cube query.

Using this logic you can mix and match any desired measures and dimensions to generate metrics charts for your own analytics.
Cube also provides you with all the code you would need to drop this chart into your own front-end app. You can choose from using React, Vue, Angular, Vanilla JavaScript for the library integration, with the option to use BI as well. We call this brand new feature SQL API. Read more about it here.
The chart itself can be chosen from Chart.js, Bizcharts, Recharts, or D3. The option is entirely your own. Cube is agnostic and lets you pick whichever you want.

To use the autogenerated chart code, click on the Code tab, copy-paste the code, and you're done. Works like magic!

You can also use Cube's built-in feature for generating metrics dashboards. I took the liberty of creating one for you to check out. Here's the end result.
You now know how to generate metrics on your own. Let's move on to security and role-based access.
Adding Multi-tenancy to Cube Cloud
Cube supports multi-tenancy out-of-the-box. You can choose to enable it on both the database and data schema levels.
To enable role-based access with row-level security I'll use a context object. It has a securityContext property where you can provide all the necessary data to identify a user
By default, the securityContext is defined by Cube.js API Token.
Start by copying the CURL command with the Authorization token.

Here's what you get.
Now, copy only the token and paste it into the JWT.io web token validator to see it does not contain any payload.

On the right side, add in a payload for "role": "stars" and add your Cube app's secret to generate a valid Authorization token.

You can find your Cube app's secret in the env vars section in the settings of your deployment.

Now you have a valid token containing a payload with "role": "stars". Let's use the securityContext and queryRewrite in the cube.js file to add a filter for the stars role. I want the role to only be able to query events of the type WatchEvent.
In your cube.js file add this code.
In Cube Cloud it'll look like this.

Save, commit, and push the changes. Run the CURL command once again with the new token.
The output will be filtered to only show the events of type WatchEvent.
By using the securityContext you can ensure your app's access rights and security, including row-level security for your ClickHouse database. To learn more, check out our recipe on using role-based access.
Conclusion
My goal with this tutorial was to explain a simpler and safer way of using ClickHouse. By using Altinity.Cloud to host and manage your ClickHouse cluster you can focus on what's important and leave infrastructure management to the professionals.
With Cube Cloud you get a metrics layer that integrates with every major data visualization library including SQL compatible charting tools like Apache Superset. On top of all that, it also comes with multi-tenancy support out-of-the-box. Among the different multi-tenancy options, you can enable tenant-based row-level security, role-based access, using multiple database instances, multiple schemas, and more.
I hope this walkthrough helped you set up your own ClickHouse instance with Altinity.Cloud and Cube Cloud.
If you want to learn more about building a metrics store with Cube check out our tutorial that explains using Cube as a single source of truth for all metrics.
You can register for Cube Cloud right away, and check out Altinity as well!
I'd love to hear your feedback about using ClickHouse with Cube Cloud in the Cube Community Slack. Click here to join!
Until next time, stay curious, and have fun coding. Also, feel free to leave Cube a ⭐ on GitHub if you liked this article. ✌️

