
Quite commonly in our applications, we need to create interactive report builders to let users build custom reports and dashboards. This usually involves selecting the metrics, groupings, date ranges, filters, and chart types. To help developers build such interactive components, we've created a query builder component in Cube client libraries.
We've already covered how to use it in the React client library, and in this blog post, we'll talk about using it with Vue.js. The query builder component uses the scoped slots technique and lets developers implement their own render logic. This way it gives maximum flexibility for building a custom-tailored UI with minimal API. Below you can see the demo of the query builder component with Vuetify.
You can find the live demo of the example here and its source code is available on Github.
Setup a Demo Backend
Let's start by installing the Cube CLI if you don't have it already and creating a new project.
In this tutorial we'll use a remote PostgreSQL database and our example e-commerce dataset. Cube uses environment variables for configuration, which starts with CUBEJS_. To configure the connection to our database, we need to specify the DB type, name and several other options. In the Cube project folder replace the contents of .env file with the following:
Now that we have everything configured, let's start the Cube development server with the following command.
Navigate to http://localhost:4000 in your browser to access the Cube Playground. It is a development environment that generates the Cube schema, creates scaffolding for charts, and lets you test your queries and debug them. It also has its own query builder, which lets you generate charts with different charting libraries.
Now let’s move on to building our own query builder with Vue.js! 💻
Building a Query Builder
We're going to use Vue CLI to generate a new project. Run the following command to install Vue CLI if you don't have it already.
To a create a new project with Vue CLI run the following command inside the Cube project folder. Make sure to select Vue 2 when asked to choose a preset.
To render the UI for query builder we are going to use Vuetify, a Vue UI Library with material components. Let's add it to our project. Run the following command inside the dashboard-app folder.
To create our color scheme you can open src/plugins/vuetify.js and add this code:
Now we can start our frontend application.
You can check your newly created Vue app at http://localhost:8080. Next, let's install dependencies we'll need for building our Query Builder: Cube Vue client, Vue Chartkick, and Chart.js.
Let's create a first simple Query Builder to allow users to select the metric from the dropdown list and then render it as a line chart over time.
Cube Query Builder component can load the list of available measures based on the data schema from the backend. We can access these measures as an availableMeasures slot prop. We'll render that list with the v-select component from Vuetify. Then when the user selects the measure, we're going to use a setMeasures slot prop to update the measures in our query and finally render the query result as a line chart with Vue Chartkick and Chart.js.
You can learn more about other slot props in the Query Builder component in the docs.
Replace the content of the src/HelloWord.vue file with the following.
Now we can use updated HelloWorld component in our App component. Replace the content of the src/App.vue with the following.
The last small change we need to make is to register the VueChartkick plugin. Update the src/main.js file.
We've just built our first simple query builder 🎉. Navigate to http://localhost:8080/ in your browser and you should be able to test it out.
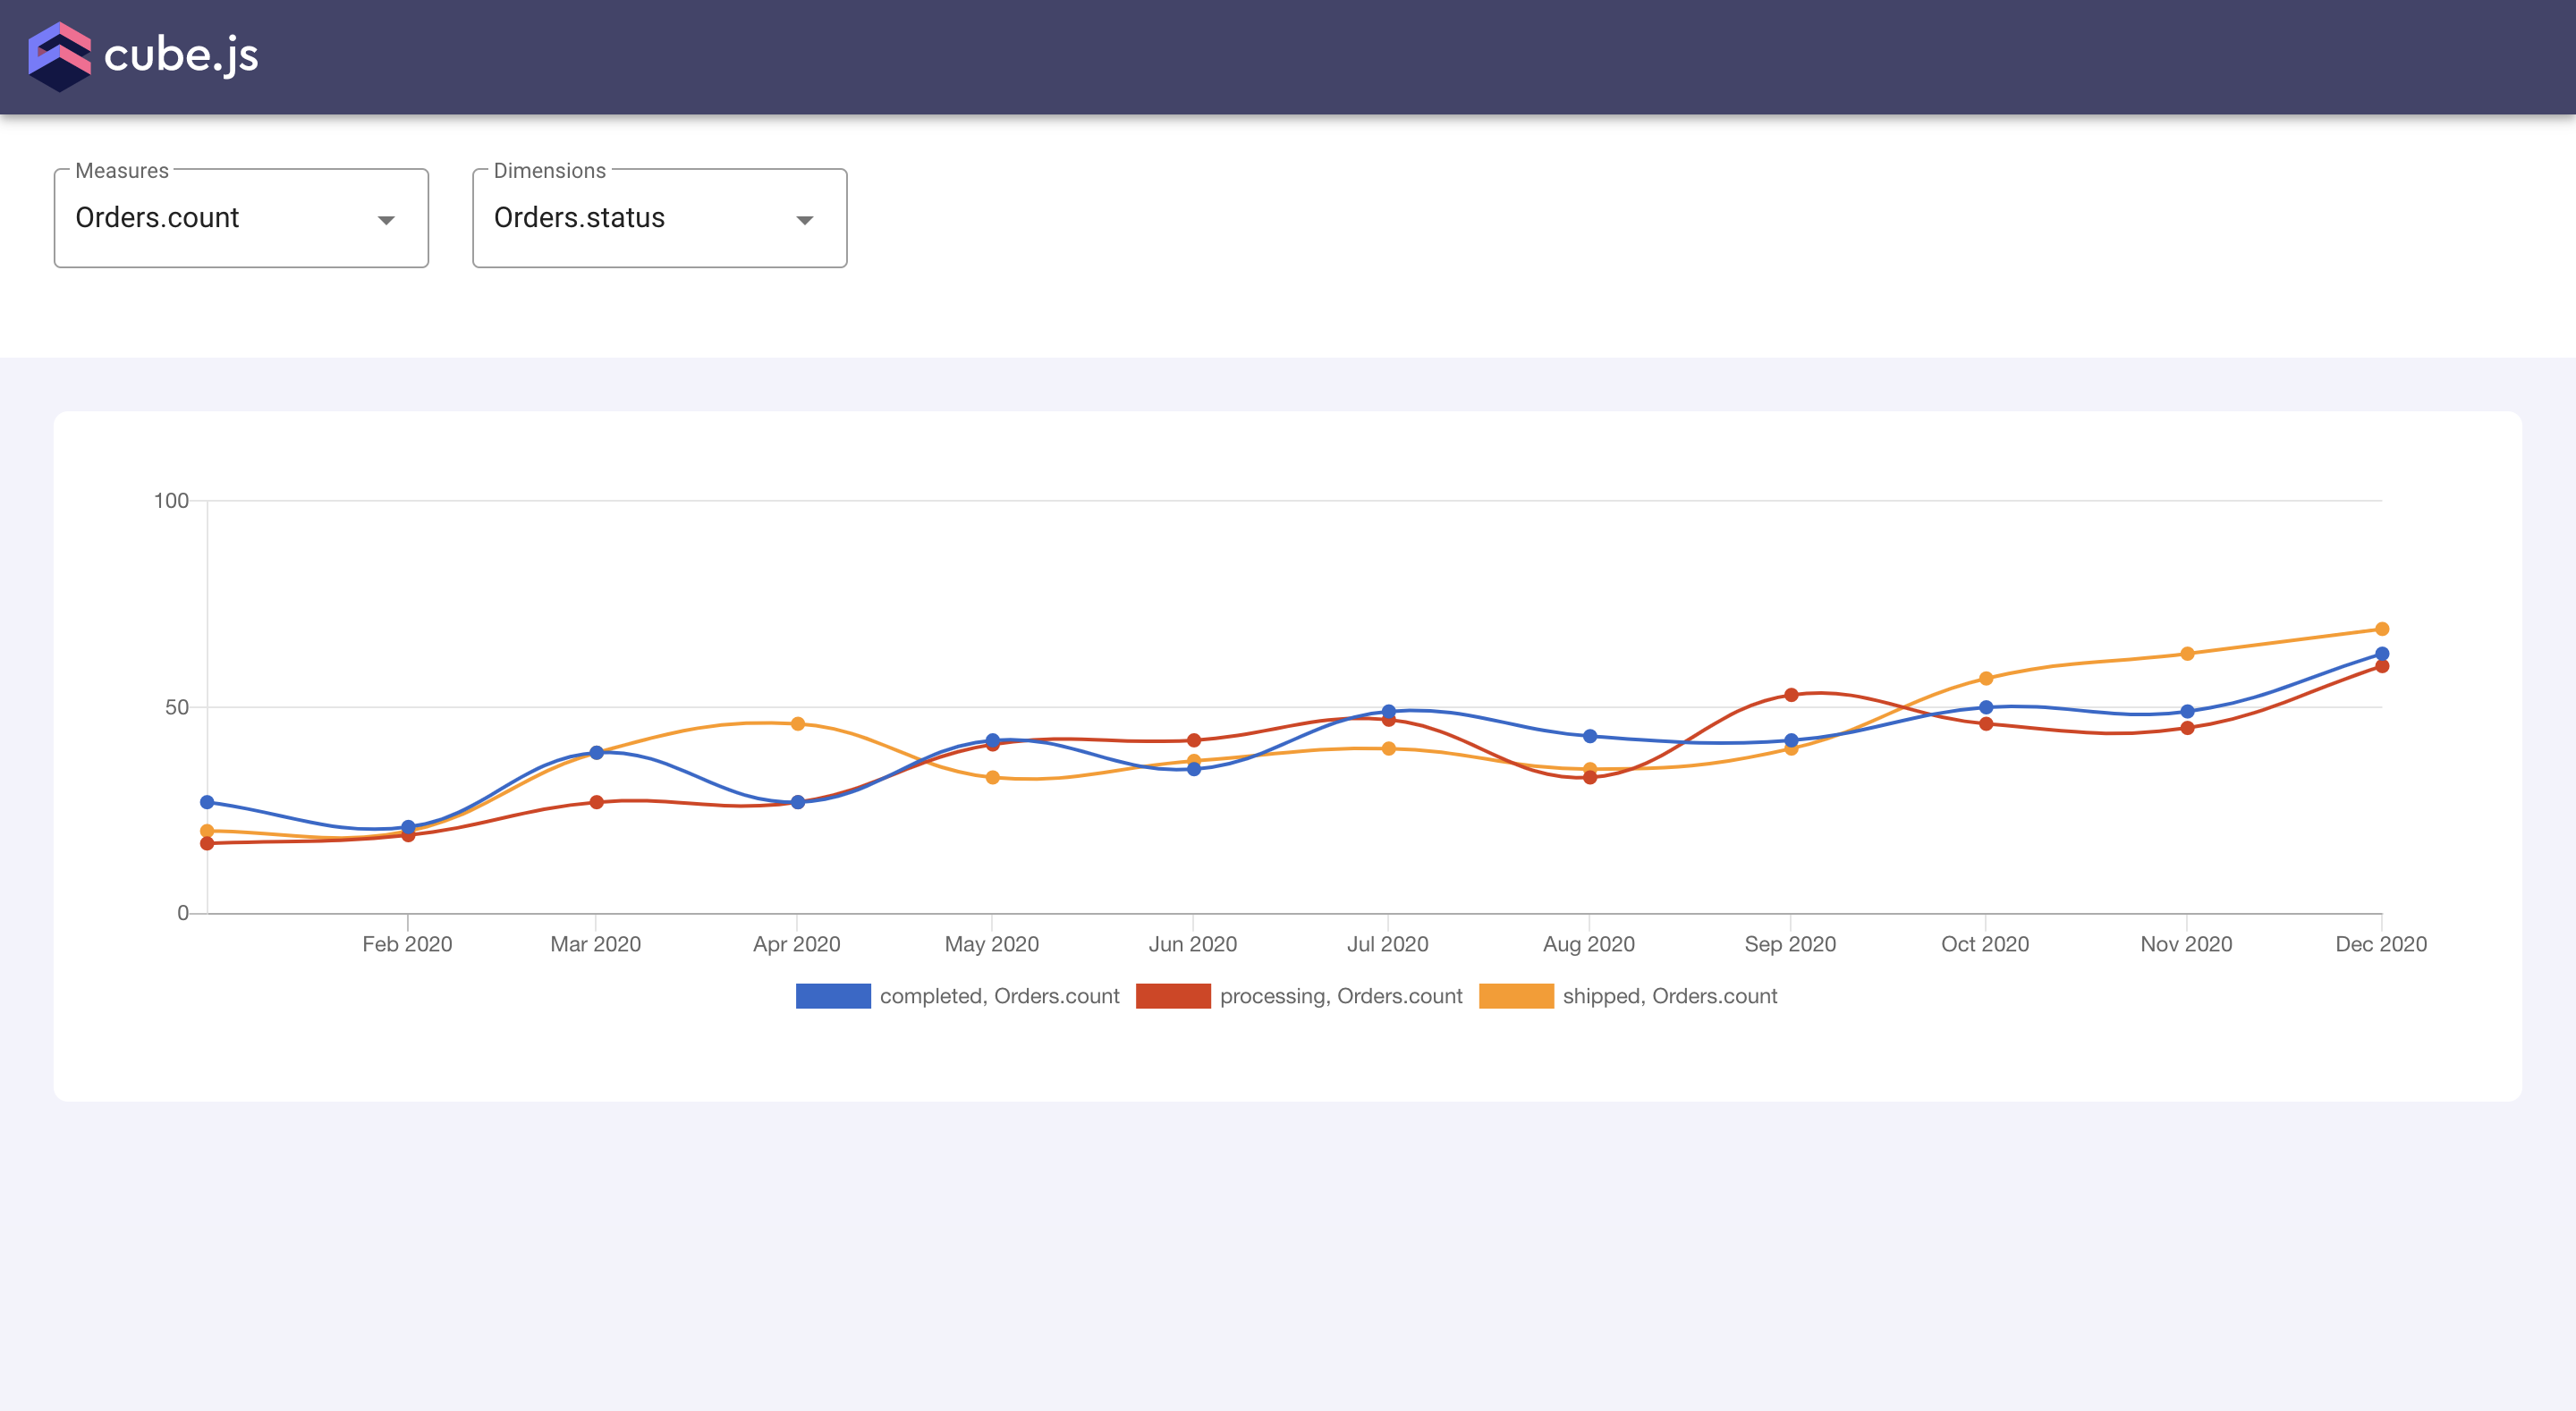
We can already plot the count of orders over time. But what if we want to see the breakdown of orders by the status? To do so, we'd need to introduce the dimensions dropdown to let users select the grouping option.
We'll use more slot props for this: dimensions, availableDimensions and setDimensions. They work they same as slot props for measures allowing us to list the available dimensions and update the list of selected ones.
Update src/HelloWorld.vue file.
Refresh your browser and now you should be able to select the dimensions for grouping as well!
That's all for this tutorial. Congratulations on completing it! 🎉
There are other controls you can add to your query builder like filters, date range, and granularity, as well as chart type selector. You can find a more complicated example with all these controls here and its source code here on Github.
Please send any comments or feedback you might have to this Slack Community. Thank you and I hope you found this tutorial helpful!

