
Analyzing funnels in an SQL database is not a hard task when you know the right queries. Using SQL language, you can dive into complex funnels and event flow analysis to gain insights into your users’ behavior. In this article, we’re going to tell how we, at Statsbot, use SQL queries for conversion funnel analysis.
Why to build funnels
Funnels are an extremely useful and helpful data tool that can provide you a great overview about your product. In a nutshell, funnels are representing several events your users perform one after another. Calculating how many unique users made each event could show you a conversion rate between each step, so you could actually localize a problem down to a certain stage.
At Statsbot, we measure how many people signed up, connected integration, and used the Scheduled Report feature. Users who performed all these actions are considered as successfully on-board.
Let’s take this process as an example and see how we can actually create this funnel with SQL. The following queries are written for PostgreSQL. You can just copy them and build your funnel right away.
Step 1 — Signup event
In our DB we have a table called Bots. Any user who signed up to Statsbot has a unique ID number and they get added to this table, so bots = users in our case.
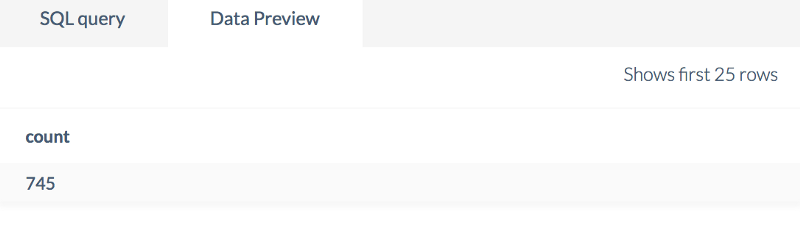
In order to get the number of signups, we simply need to choose Bots table, apply the date range we need, and specify the function, which is count.
We can see now that during this time we got 745 signups.
Step 2 — Calculating Integration connected event
Next, we need to find out how many out of those 745 users connected at least one integration.
In our DB we have a table called “Integrations” that contains an integer value representing how many integrations have been connected by user.
We now need to make a following SQL query to get the result. Note that we are querying a number of integrations connected by users out of those who signed up in May, which we defined in Step 1.
Awesome! The result is 104 integrations that had been connected by users who signed up in May.
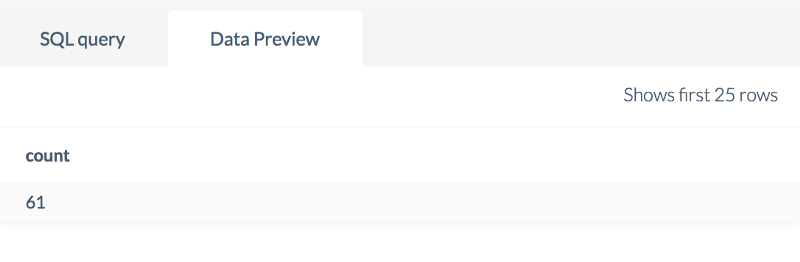
Step 3 — How many users scheduled at least one report?
Okay, the next step is exactly the same as the previous one. We just add another event from a scheduled_reports section with the same condition to complete this nested query.
The result is 61 users have scheduled at least one report.
Step 4 — Putting all pieces together for creating a funnel analysis
This is where the most interesting part comes in. Let’s take all the logic we’ve worked on together and create the conversion funnel — our initial goal.
This is what our final result looks like after visualization.
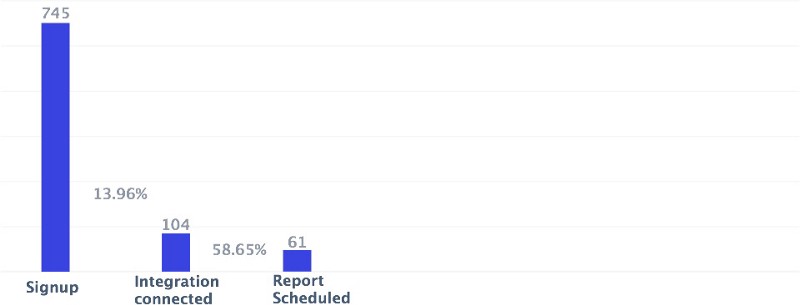
This funnel gives us the insight that we have some problems with onboarding and connecting the first integration. Then, we can make some changes and build the same funnel in one week to measure whether the conversion rate increases or decreases.
Further, we can detect 43 users who connected the data source but didn’t schedule the report yet. They are in churn risk, and we need to get in touch with them quickly to get back on track.
You should also remember one important thing: we created a funnel, which is affected by a slowly changing dimension problem. In our case, users are signed up in May, but at the same time they could add more integrations and schedule more reports during their customer life cycle. This might result in changes to the numbers in Step 2 and Step 3.
If you have an event based system, then a slowly changing dimension problem can be eliminated. For example, we use Mixpanel to build the same funnel this way:
These 4 steps are easy to follow to build your first funnel in SQL. We hope this will be a good start to customizing your analysis with SQL power!