
We recently covered how to build an analytics dashboard using react, vue, or angular. But if you don't want to code and host your own dashboard, you have some open-source alternatives. Today I'll show you how to build an analytics dashboard using Cube Backend and Redash. You can find the resulting dashboard live here.
Why Cube?
You can always connect Redash directly to your database. You can then write queries in pure SQL and build the same dashboard. It's easy to manage if you have one dashboard and just a couple of queries. But usually, a small dashboard is just a first step in building a complex analytics solution. As your business grows, your volume of data also grows. And soon, you may find a hundred dashboards with thousands of queries used by multiple departments. Now imagine you changed a column in the database. All of the queries should be checked and updated.
Another problem may be the data volume. Say you have a large dashboard powered by some complex queries that take some time to execute. Once you change a filter value on that dashboard, all queries will get executed on the database. In a simple case, it may take a long time to update the dashboard, but if you're using a per-query billed database like Google Bigquery or AWS Athena, this will also hit your monthly bill.
Cube solves both of these problems. The queries used in Redash may be updated independently, so updating a column name or adding a join condition is a simple update in the data schema file. Also, Cube.js Backend manages pre-aggregations, which helps with loading lots of data fast and efficiently. Cube pre-aggregates data for huge queries in separate tables and updates them in the background. This is efficient in terms of performance and cost. Here you can find a guide on Cube Data Schema to understand core concepts better.
Setting up Cube Backend
To launch a Cube Backend, you'll need to provide a database where your analytics data is stored and a hosting option. In this demo, we'll use Postgresql database with our demo dataset. If you don't have access to your analytics database right now, you can use this dataset:
Now when you have your database running, we have to choose a deployment option. For this demo, we'll host our backend on Heroku. There's a guide for other deployment options in the documentation.
Let's install cubejs-cli and create a new Cube.js app:
Now we have to set a data model. For this demo, we'll define only one cube and skip advanced options, which are covered in the documentation.
Now when we have our data model set we can deploy this app to Heroku:
Creating a Redash Dashboard
To use Cube Backend with Redash, you need to create a JSON Data Source.
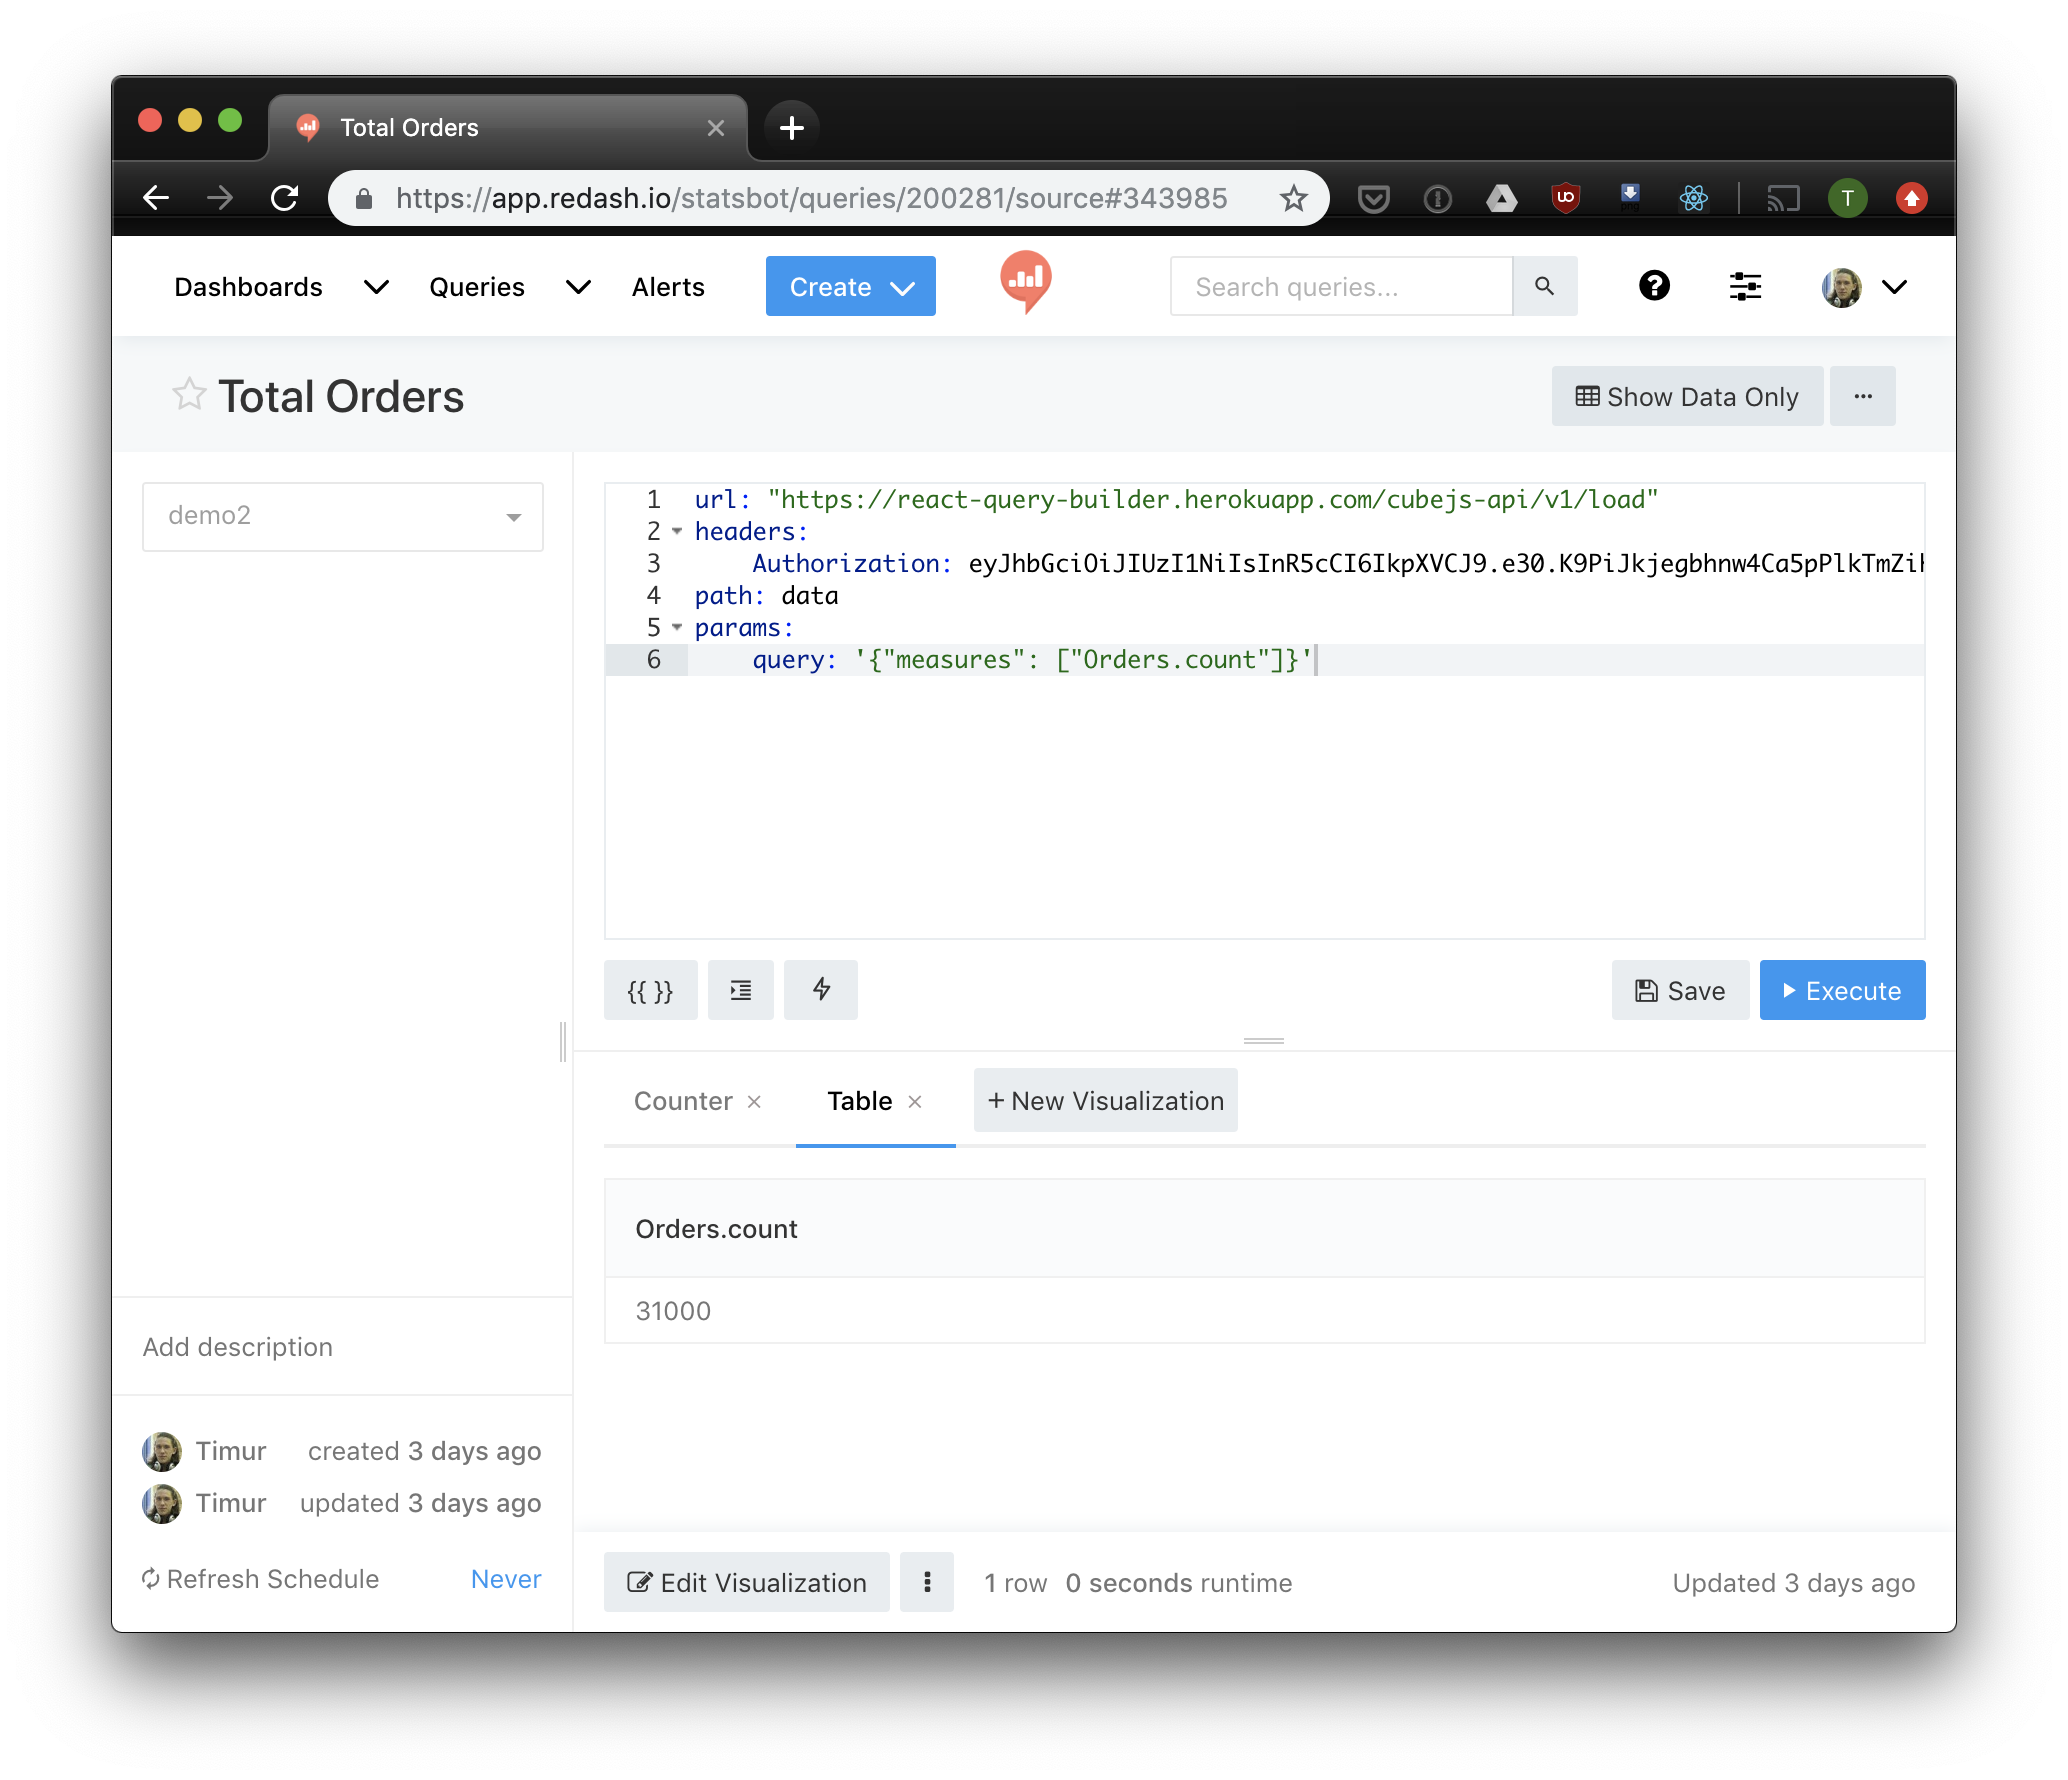
Once you've done that, you can create a query. There are a couple of options like URL and Authorization Headers that will be shared across all of the queries, so you can create one query and then fork it to create others. Here's a simple query that will count all Orders in our demo dataset:
Here you need to provide your API URL, which depends on the deployment option you chose. Also, you need to create an API Token to authenticate requests. Now click "Save" and "Execute." You should get a response that looks like this:
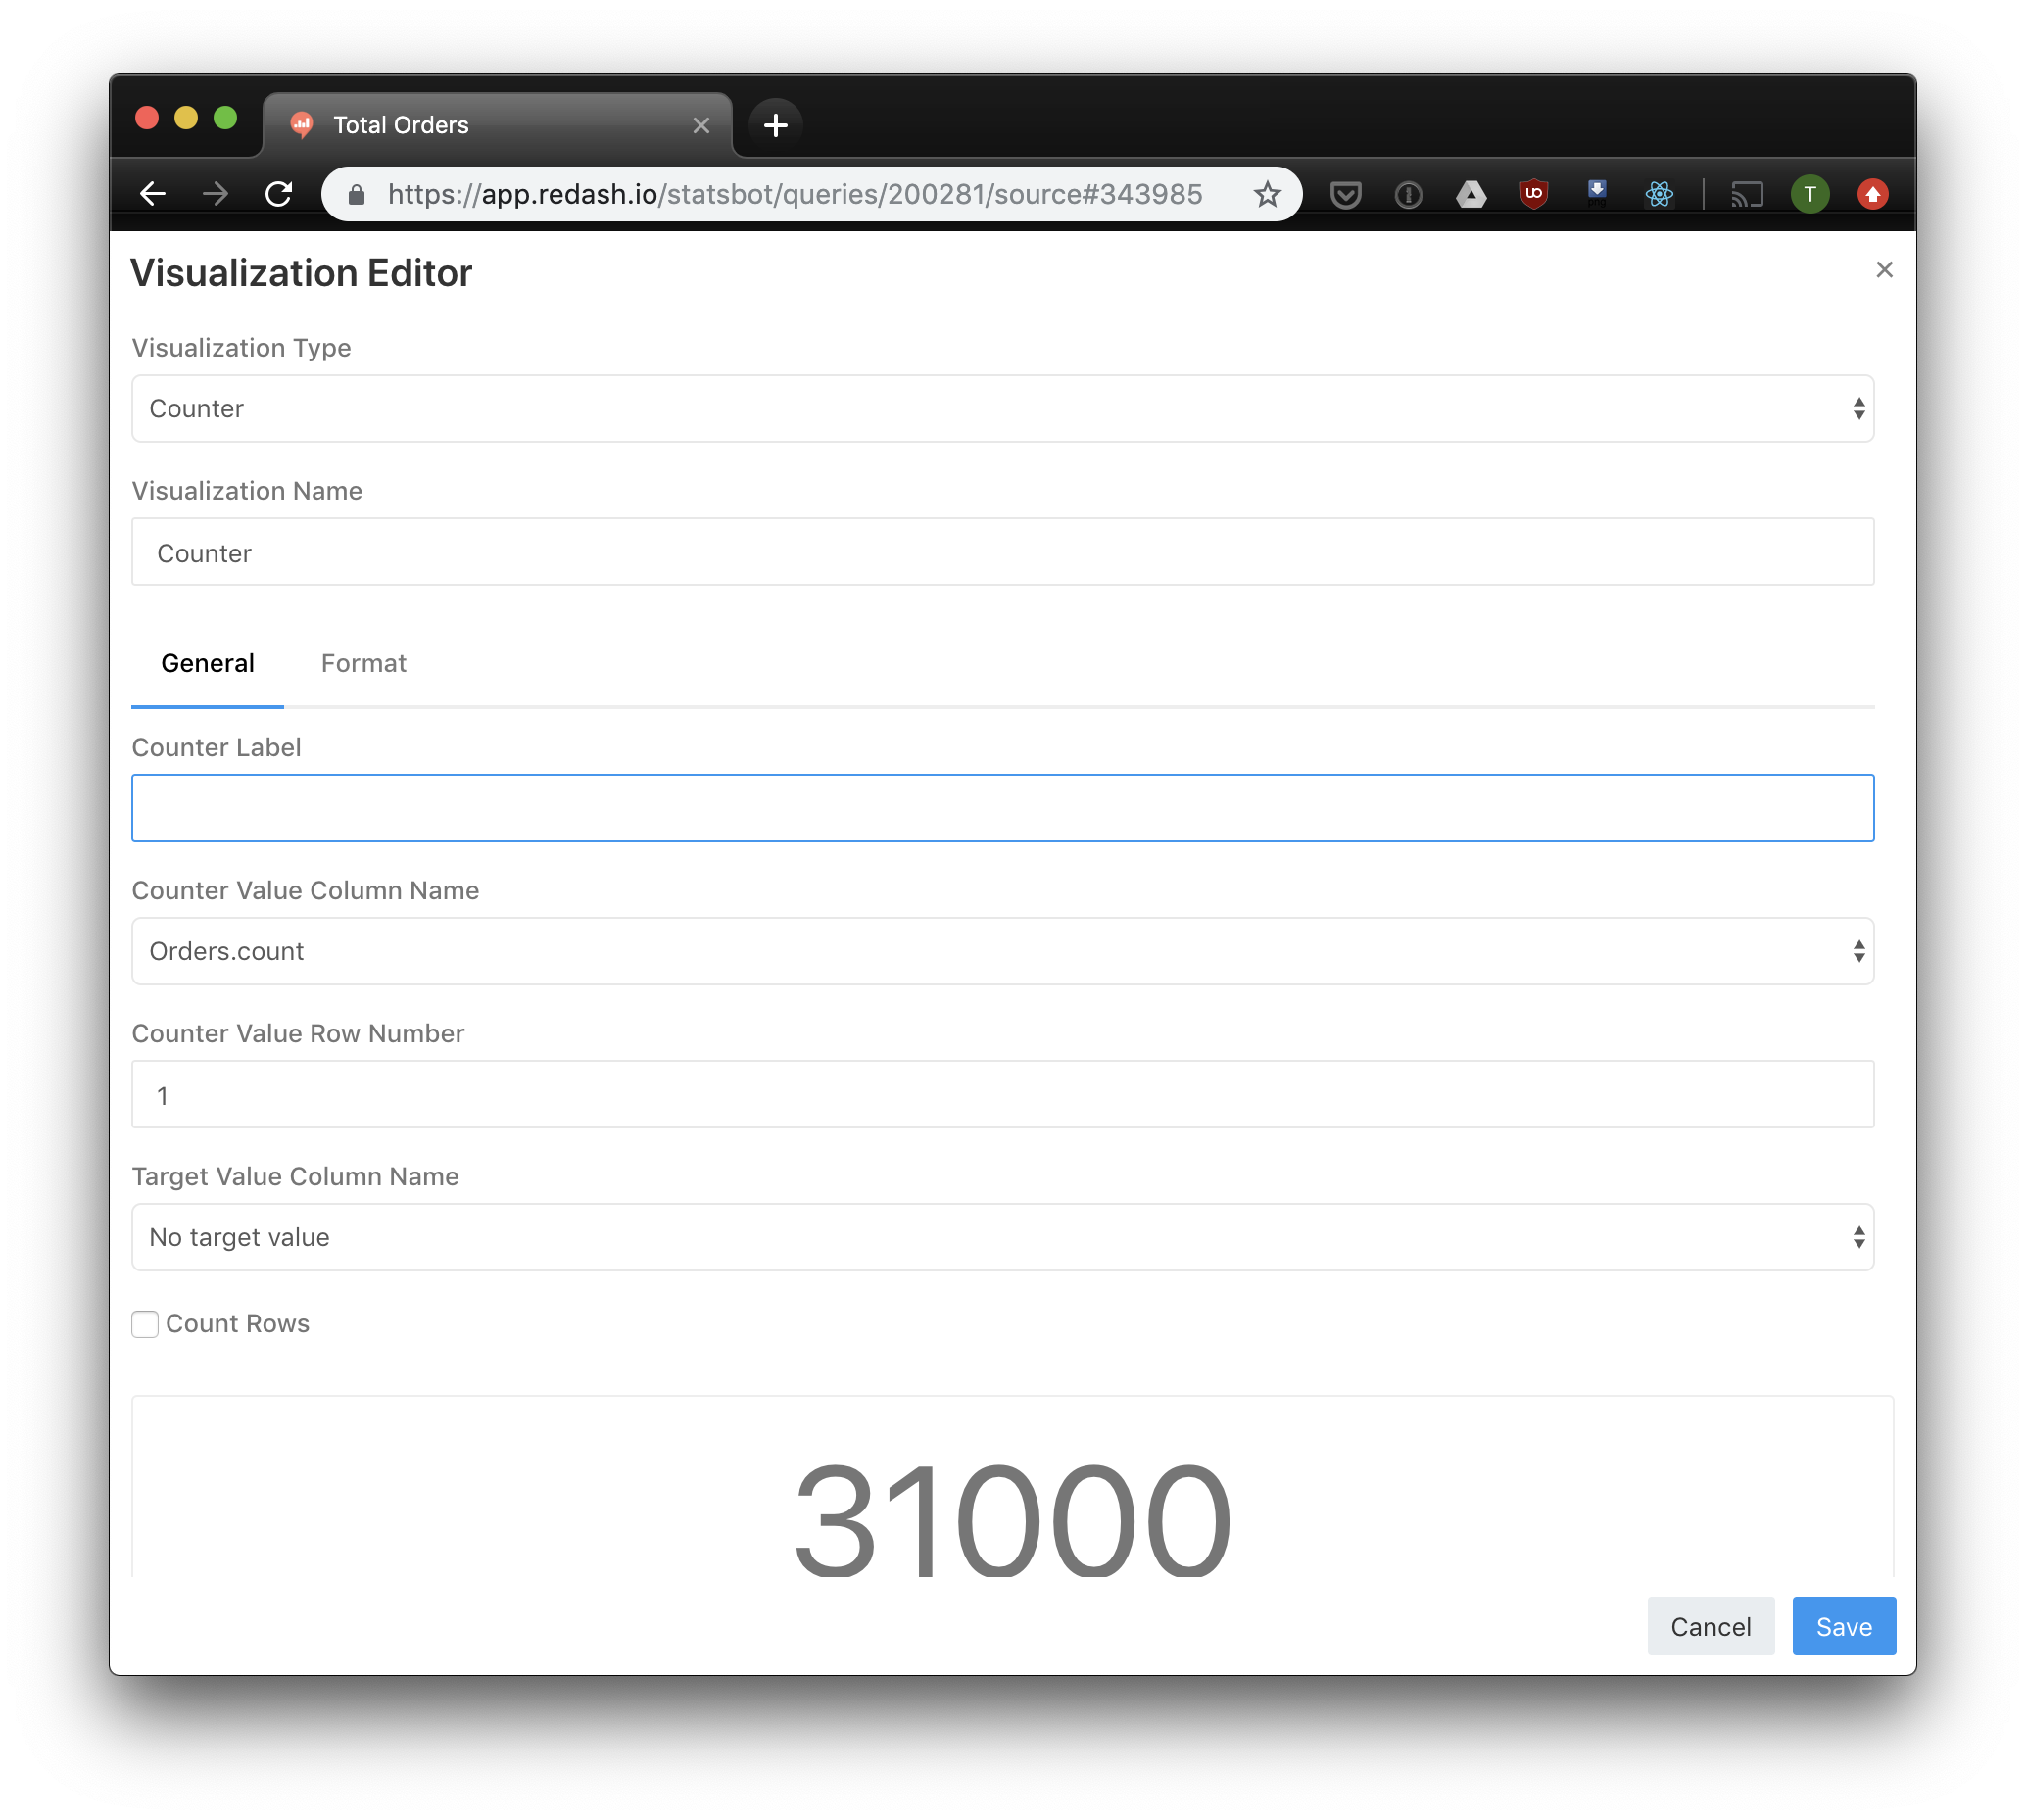
Now you can add a visualization. For this query, we'll use a simple "counter" option:
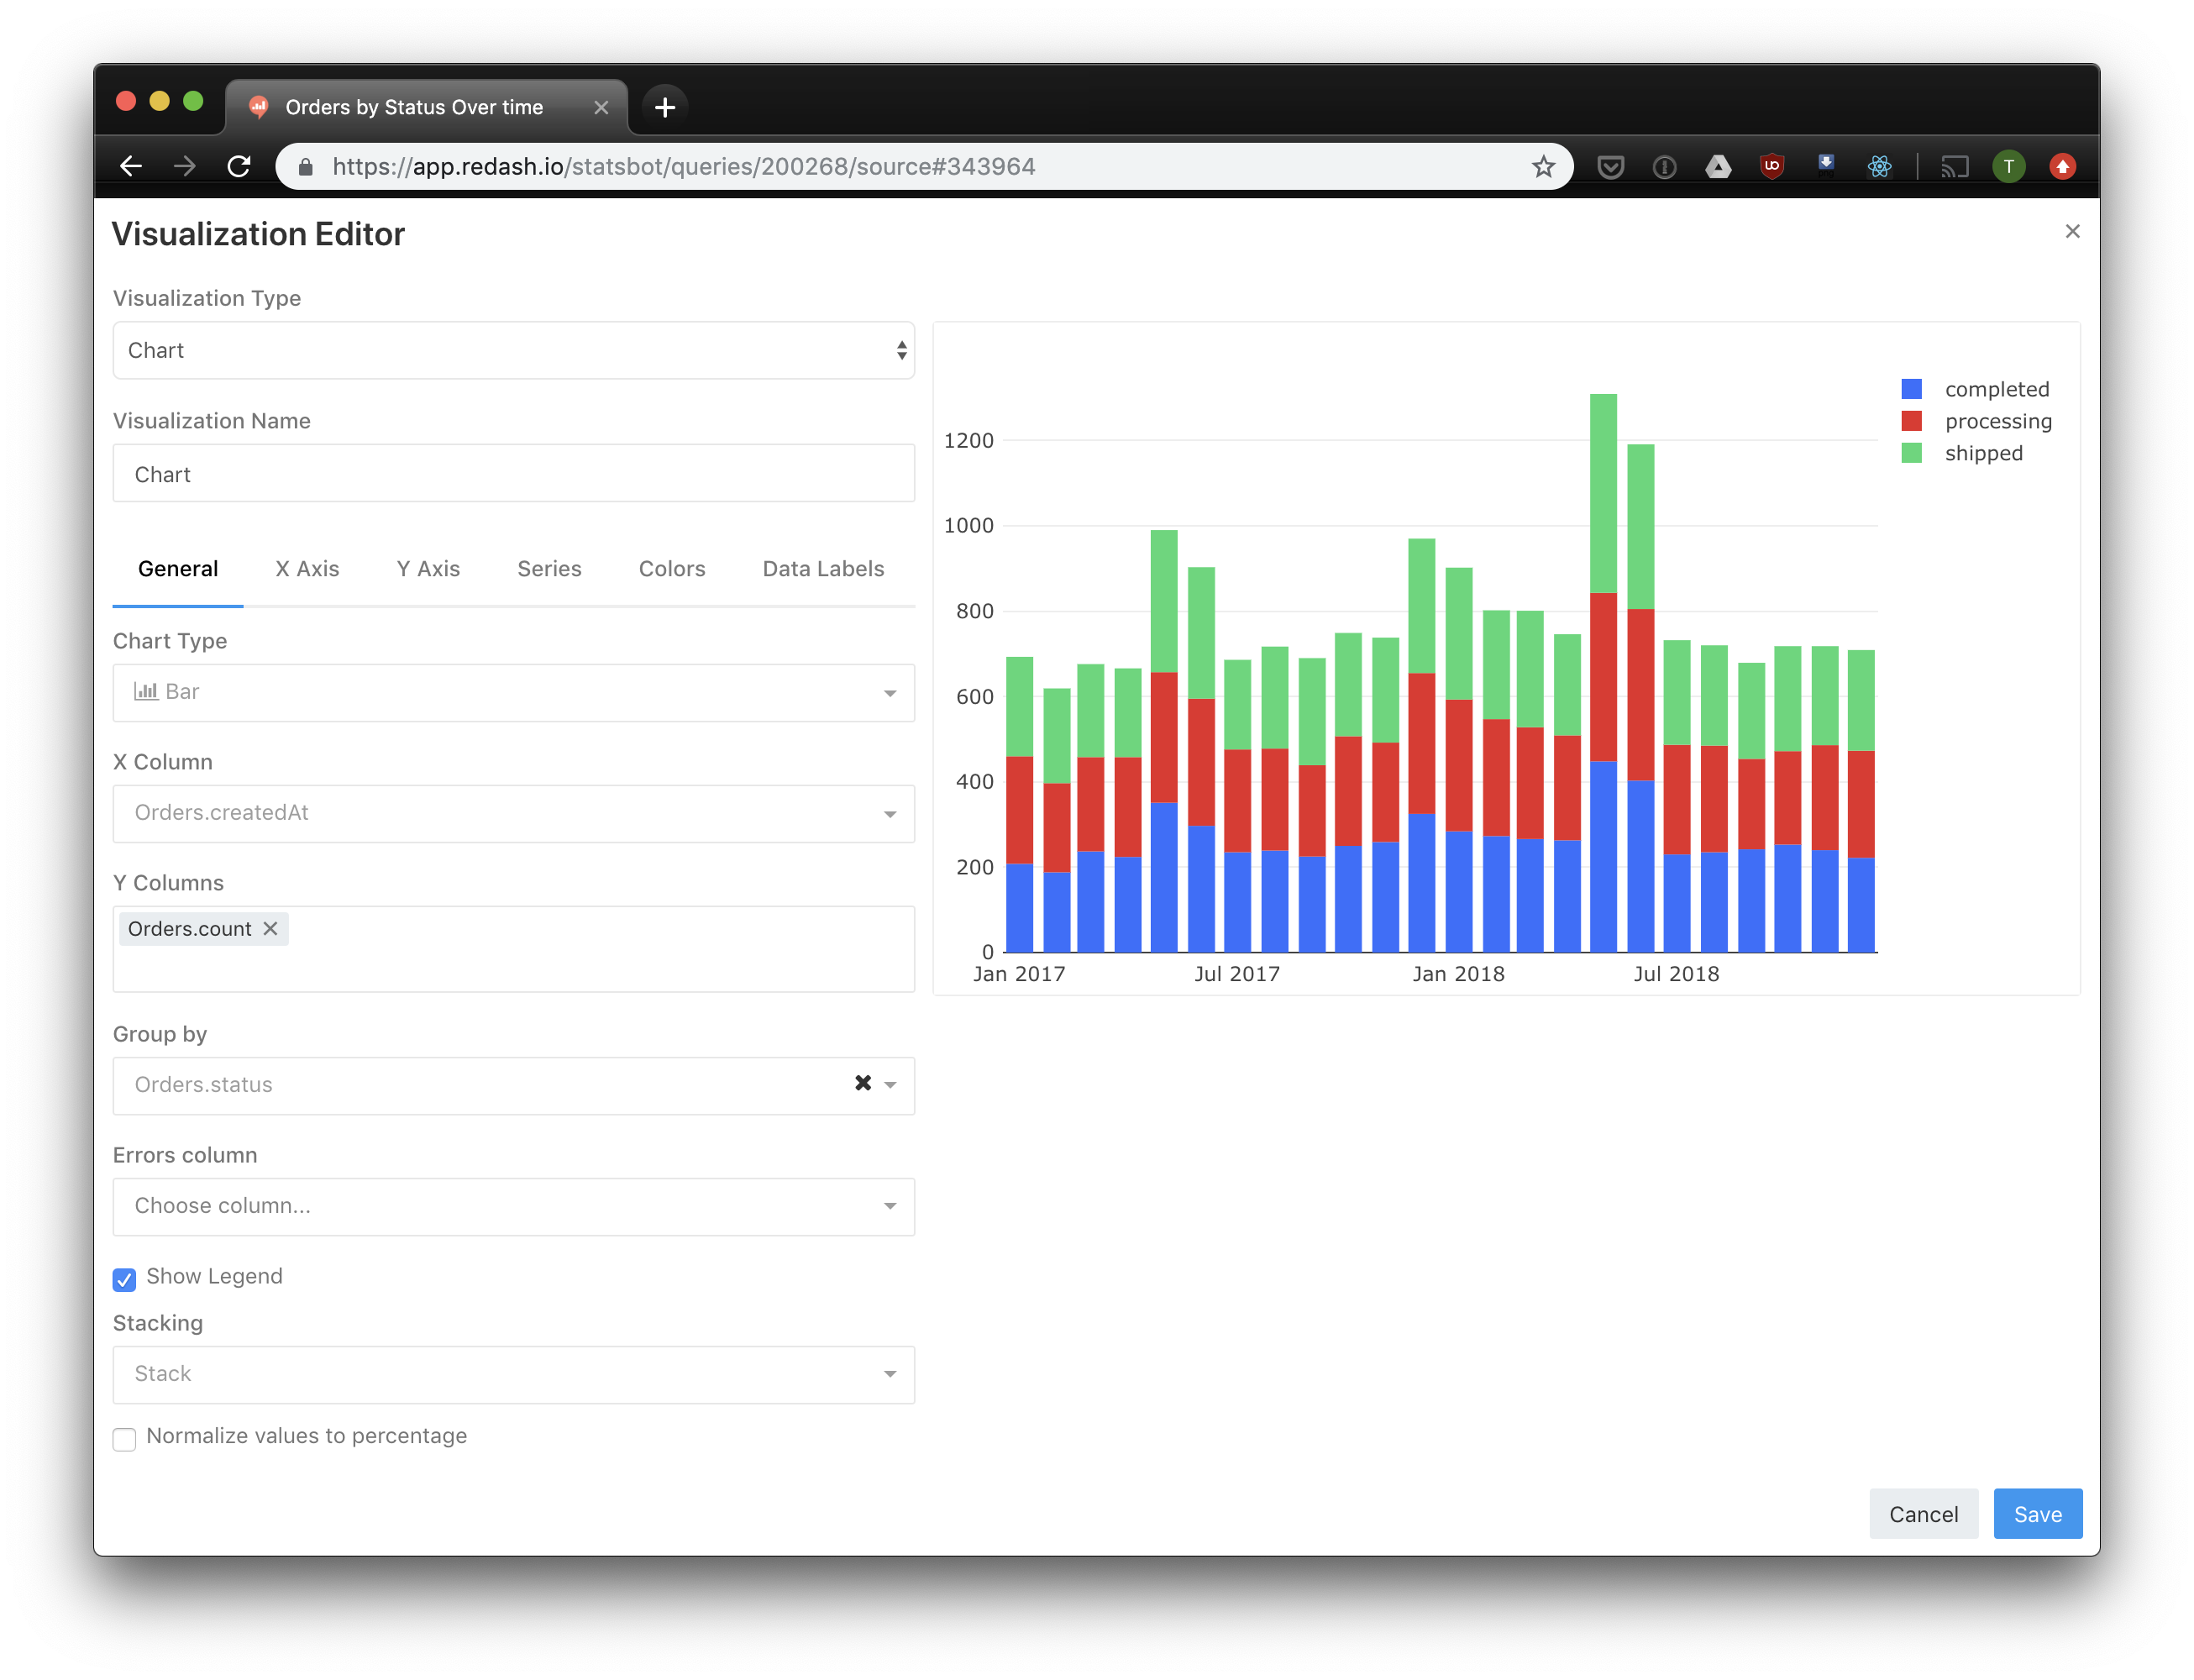
Let's create a more sophisticated query. We'll create a Stacked Bar Chart for the orders. First, let's define the query:
Save and execute the query and you'll get a table, which is the default visualization. Let's create a Bar Chart:
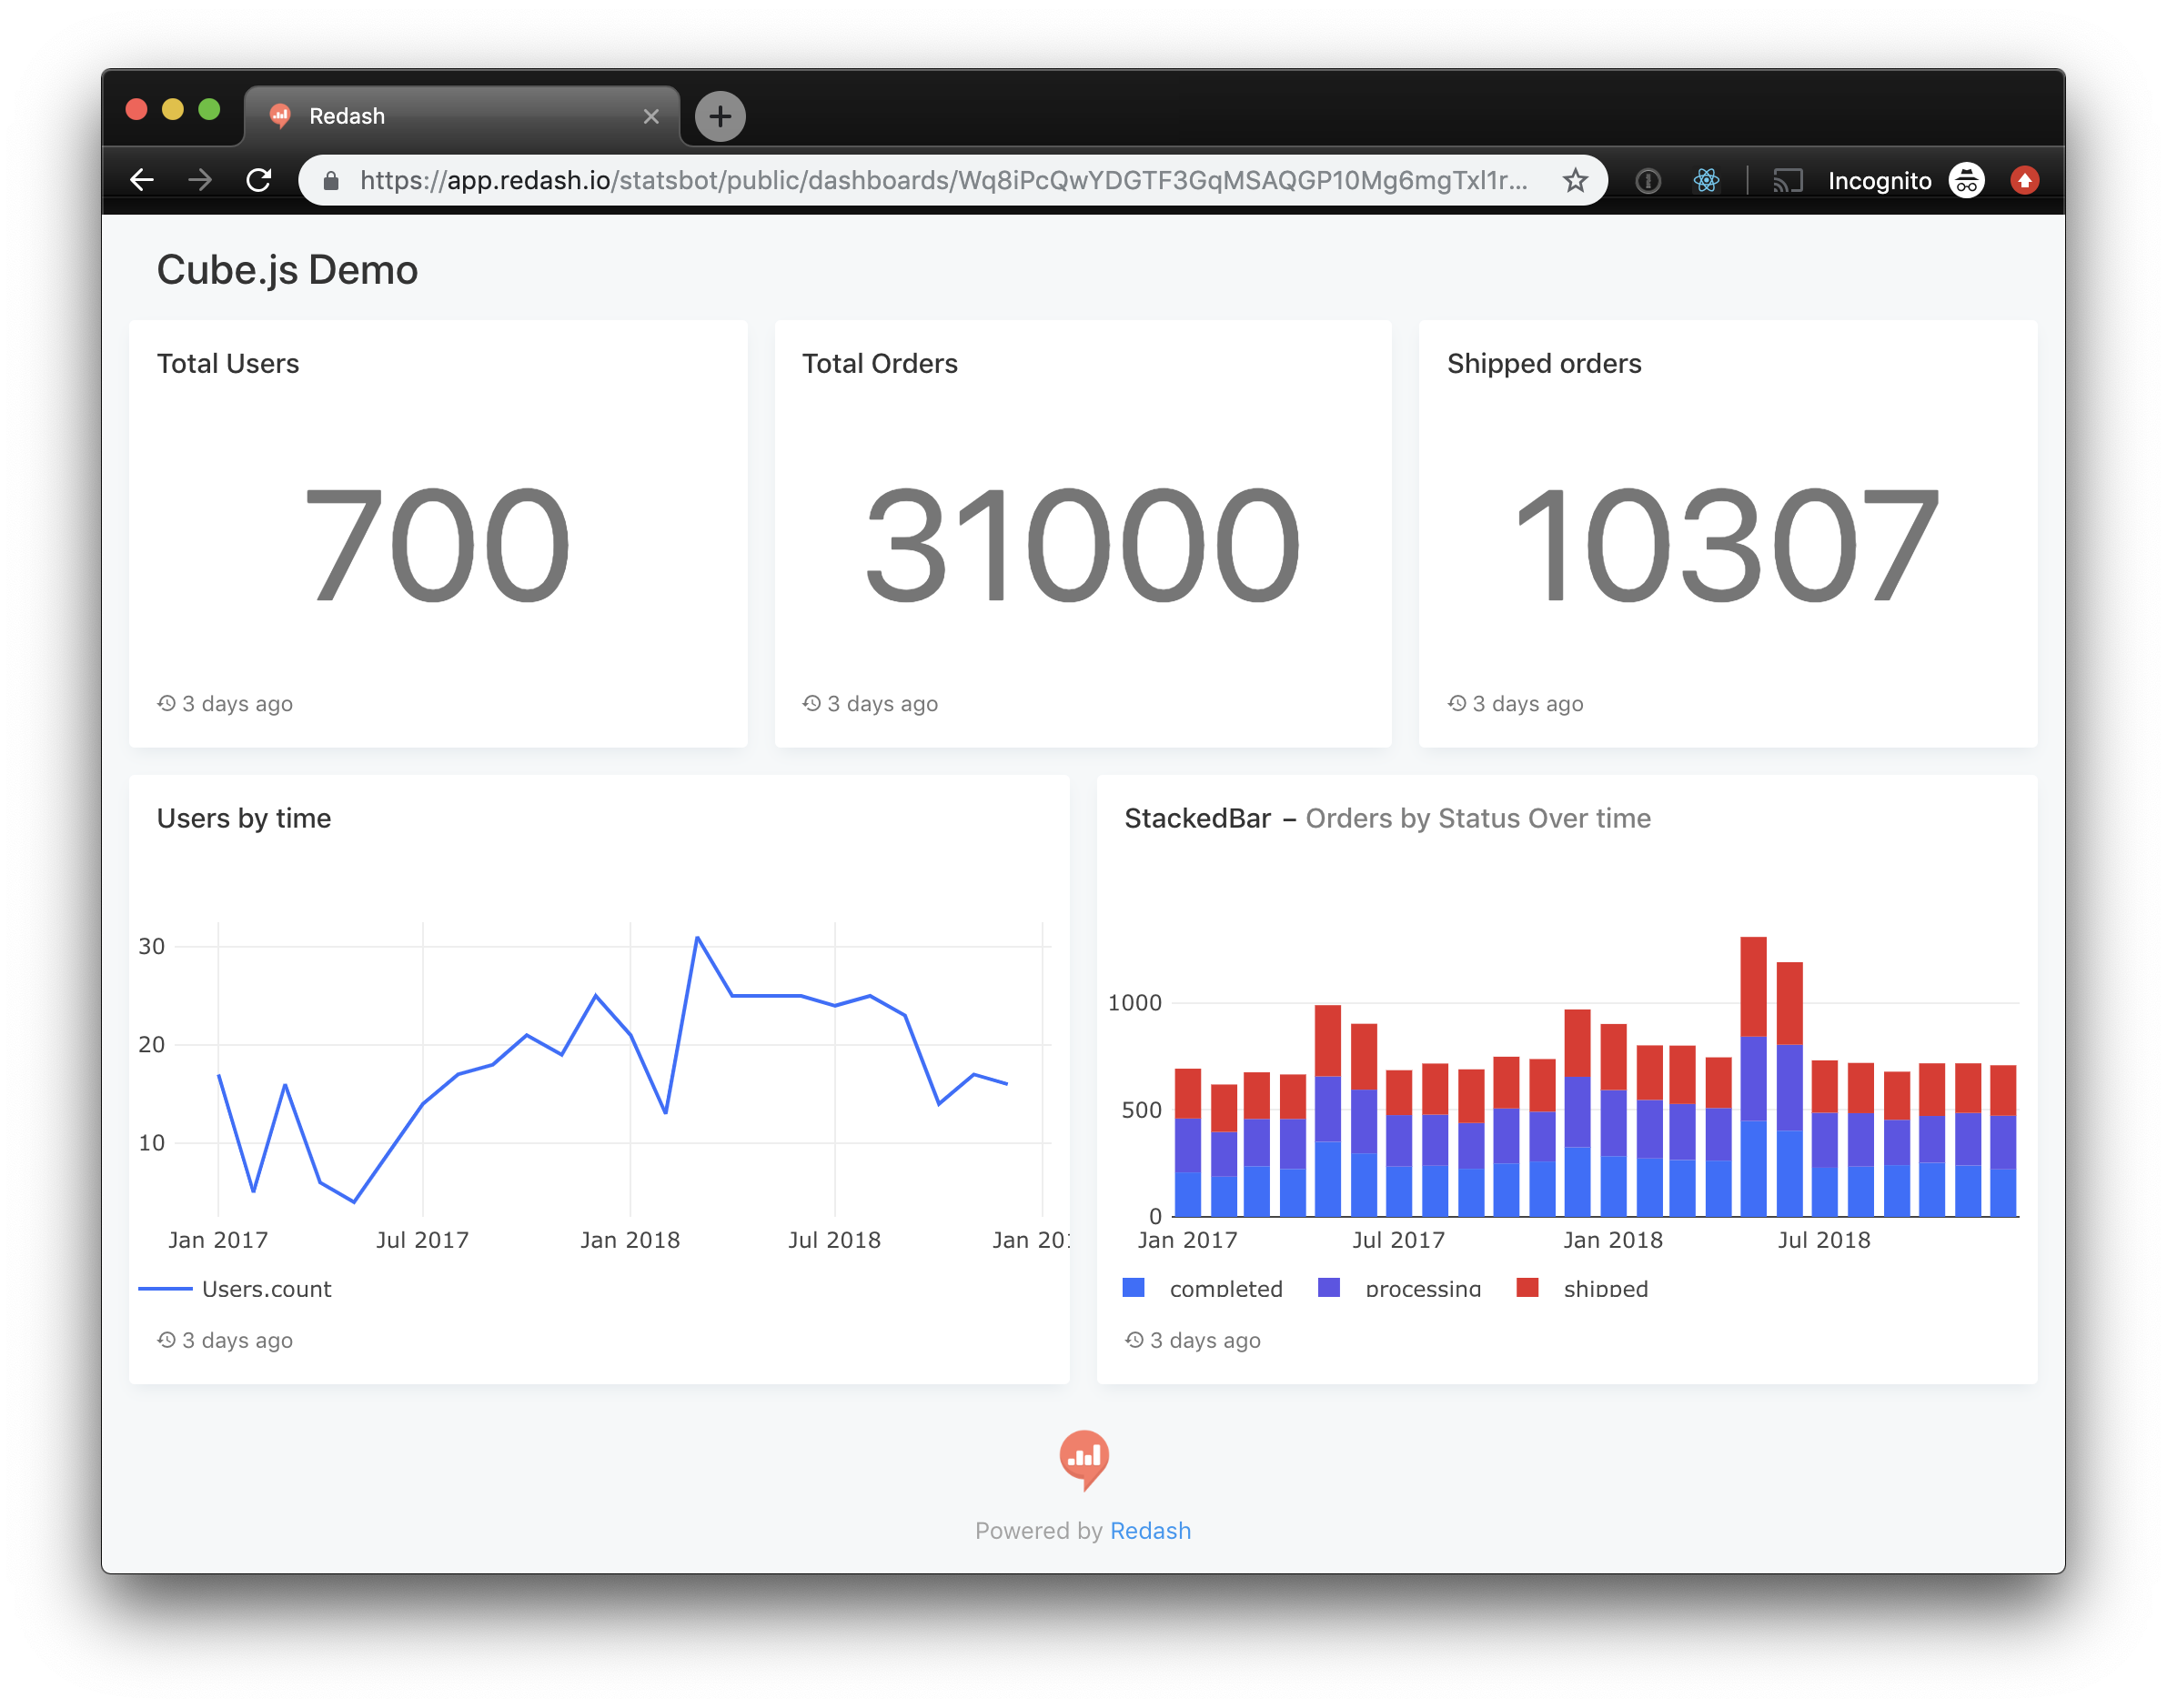
Now we have enough queries to create a dashboard. Click "Create" -> "Dashboard," choose a name, and go ahead adding your query widgets.
And the dashboard is done!
Setting Filters
There's also a Redash option called Parameters. We can set some query values using it. Let's add a daterange filter to our queries:
You can see we've added params using the {{ }} expression. Now let's change the parameter type to daterange:
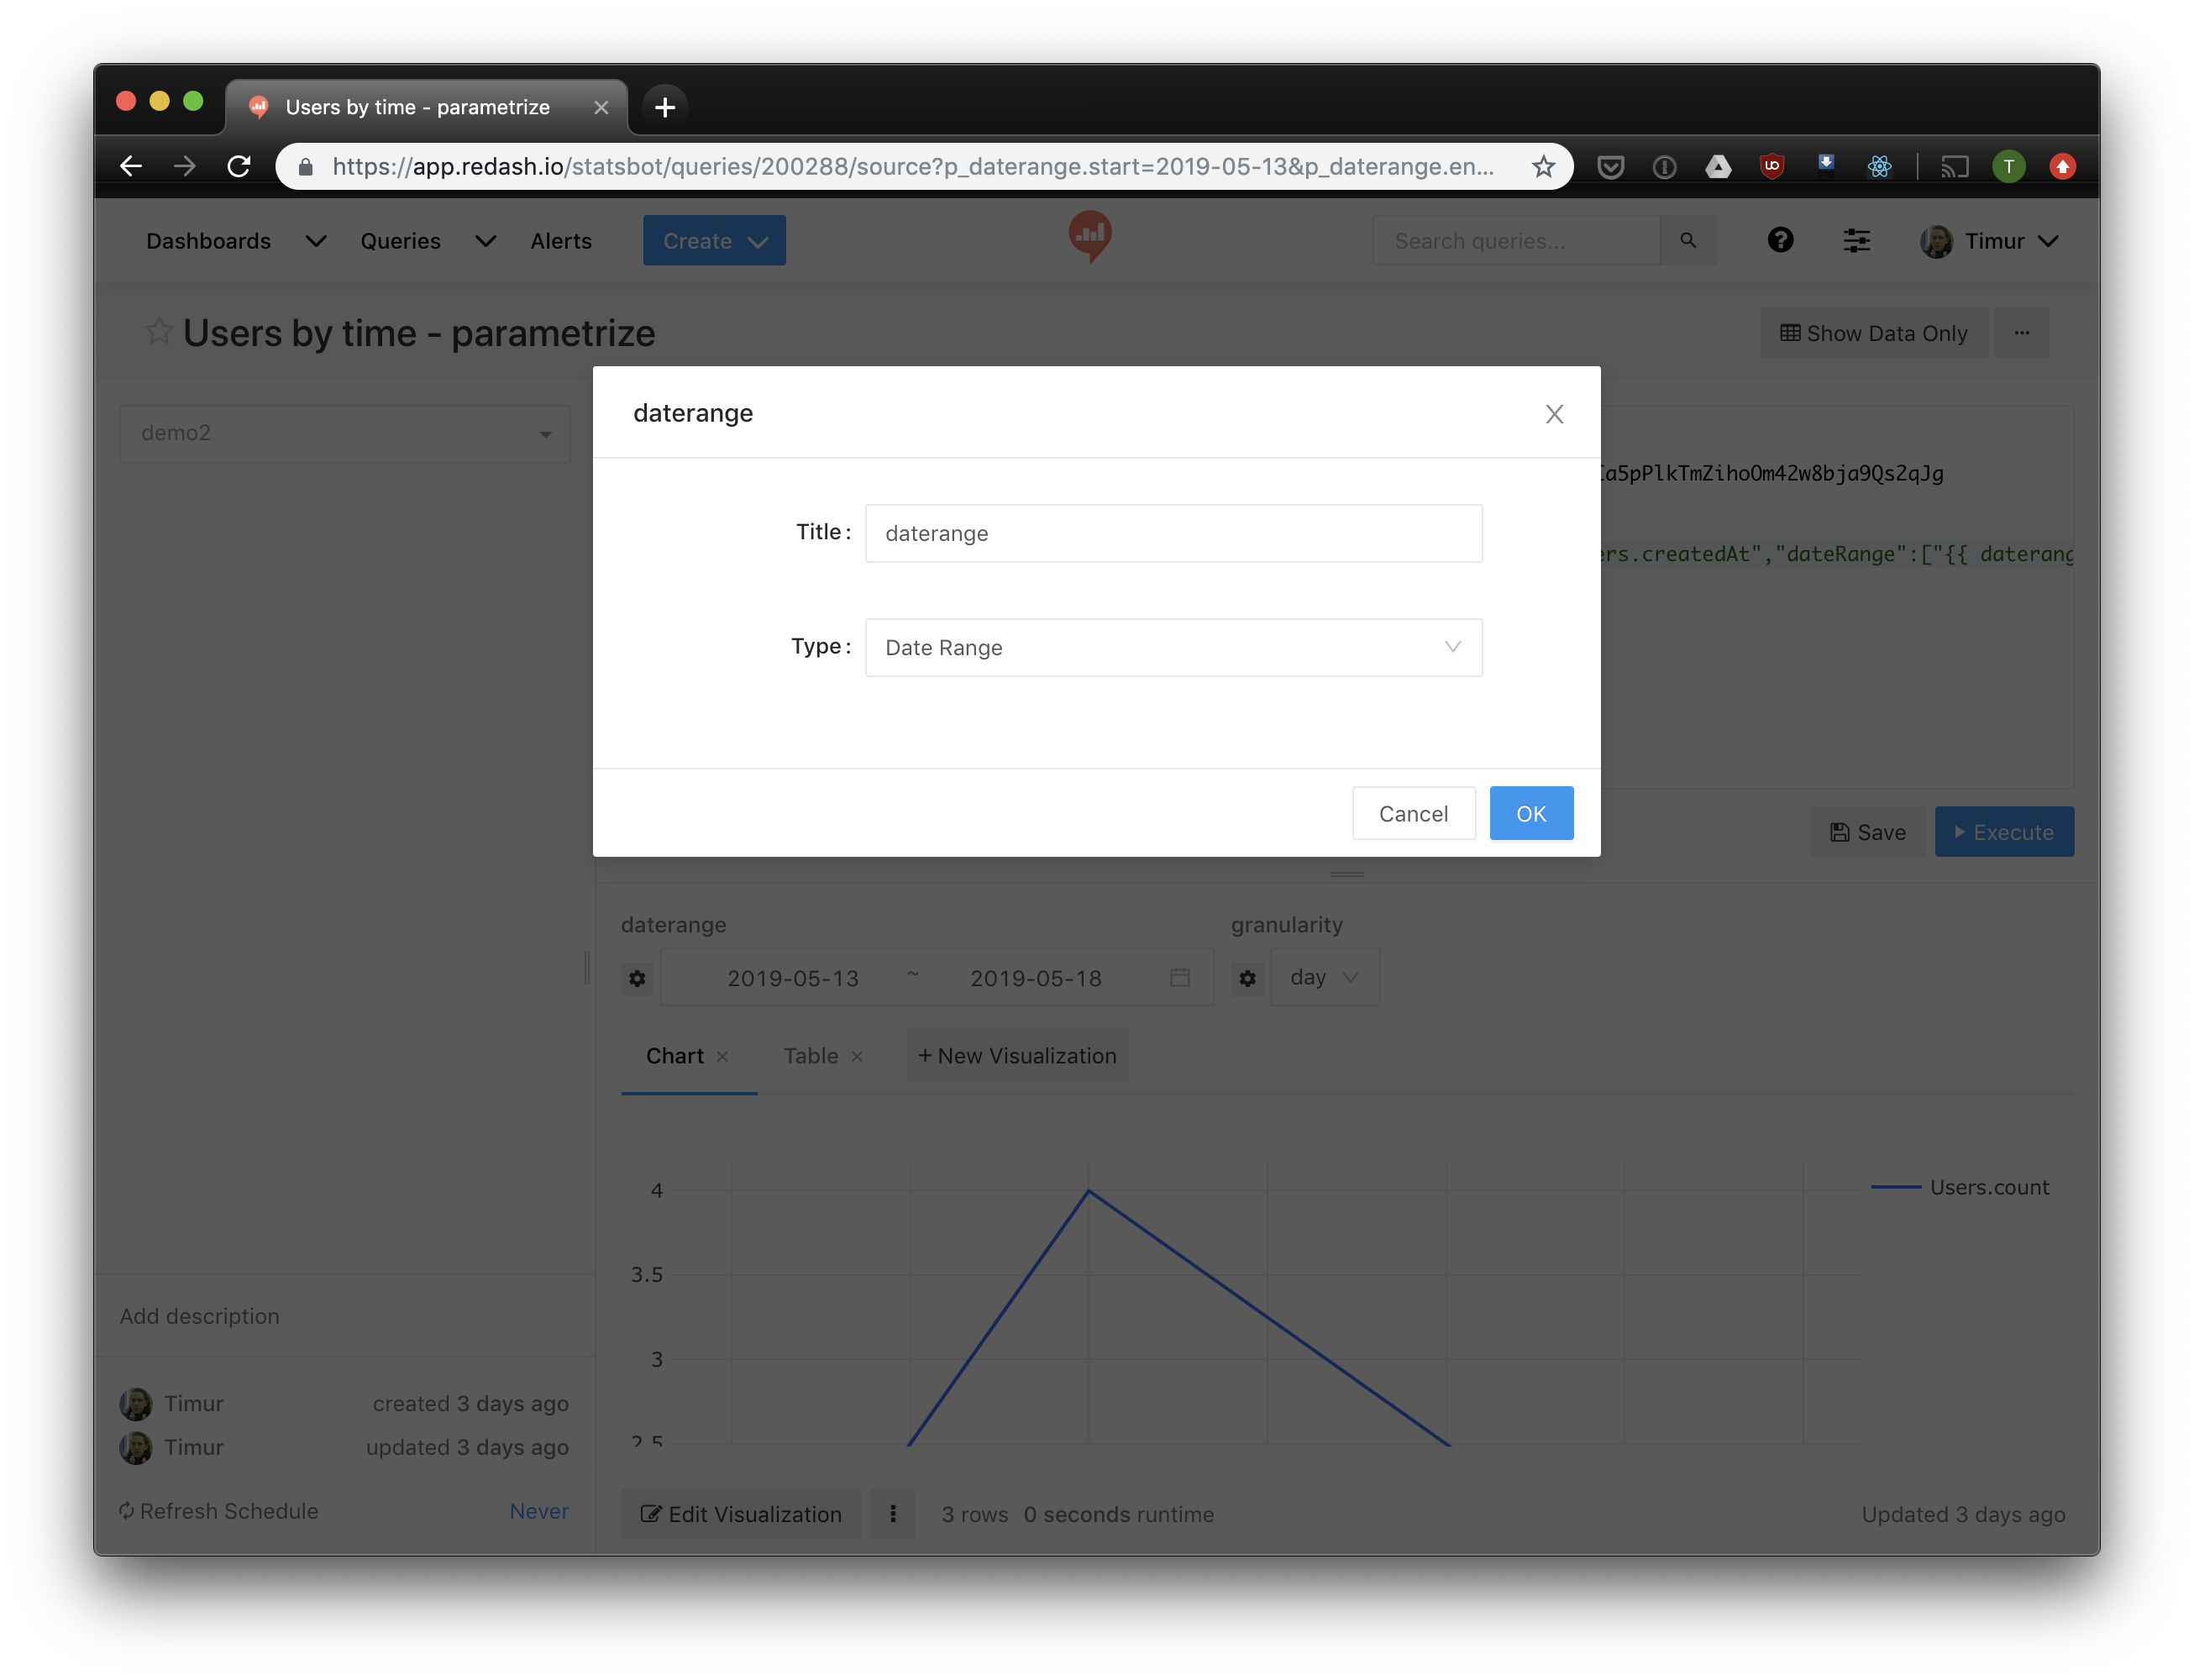
Click "Save" and "Execute." Now this query has a daterange filter. You can add other parameters to the query in the same manner. Also, you can set multiple queries to use one dashboard-level filter value using the "edit Parameters" menu. Here's an example:
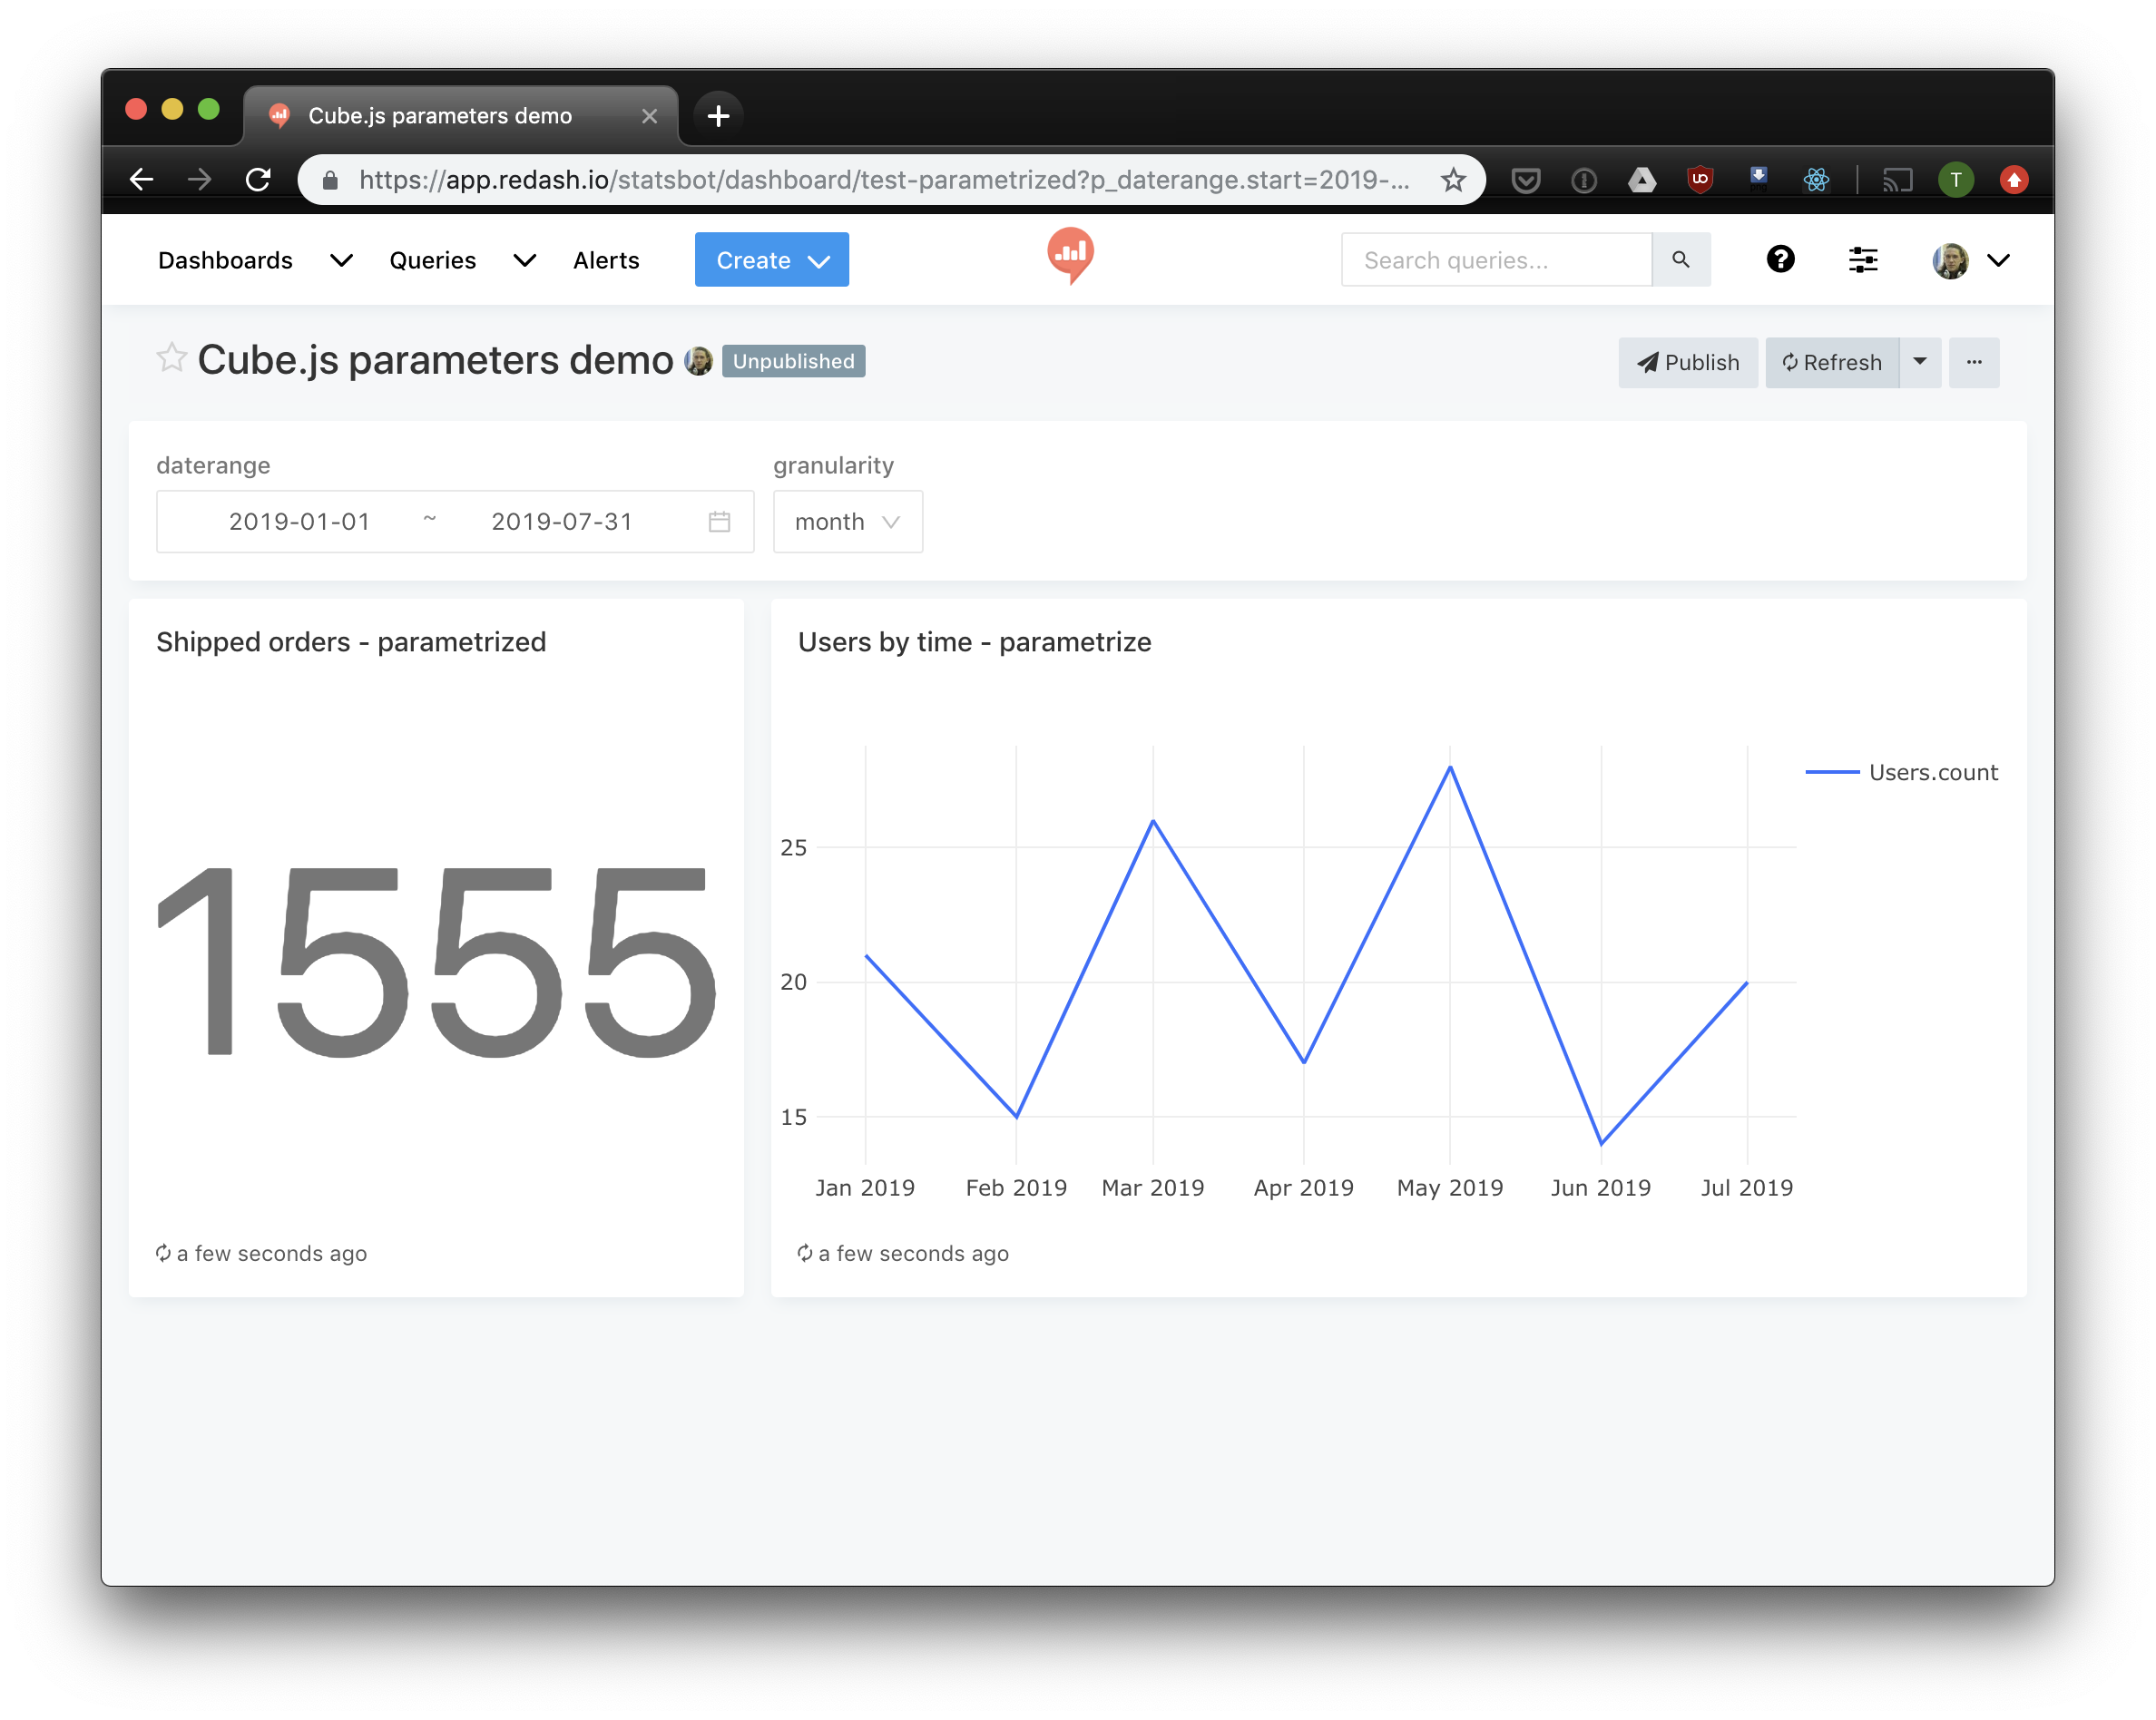
And it's done! Now we have a live dashboard in Redash, which you can publish, query, or even run on a display with auto-update.