
Cube is an open source framework for building analytical web applications. It is primarily used to build internal business intelligence tools or to add customer-facing analytics to an existing application. In a majority of cases, the first step of building such an application is an analytics dashboard. It usually starts with—“let’s add an analytics dashboard to our admin panel.” Then, as it always happens in software development, things get more complicated, much more complicated.
When we started working on Cube, we wanted to build a tool, which is simple to start but scales easily in features, complexity, and data volume. Cube puts down a solid foundation for your future analytical system, whether it is a standalone application or embedded into the existing one.
You can think about this tutorial as “Cube 101.” I’ll walk you through the basic steps of designing the first dashboard from the database to visualizations.
The live demo of the final dashboard is available here. The full source code is on Github.
Architecture
The majority of modern web applications are built as a single-page application, where the frontend is separated from the API. The API is also usually split into multiple services, following a microservice architecture.
Cube embraces this approach. Conventionally you run Cube API as a service. It manages the connection to your database, including queries queue, caching, pre-aggregation, and more. It also exposes an API for your frontend app to build dashboards and other analytics features.

API
Analytics starts with the data and data resides in a database. That is the first thing we need to have in place. You most likely already have a database for your application and usually, it is just fine to use for analytics. Modern popular databases such as Postgres or MySQL are well suited for a simple analytical workload. By simple, I mean a data volume with less than 1 billion rows.
MongoDB is fine as well, the only thing you’ll need to add is MongoDB Connector for BI. It allows executing SQL code on top of your MongoDB data. It is free and can be easily downloaded from the MongoDB website. One more thing to keep in mind is replication. It is considered a bad practice to run analytics queries against your production database mostly because of the performance issues. Cube can dramatically reduce the amount of a database’s workload, but still, I’d recommend connecting to the replica.
To summarize— If you use Postgres or MySQL, just create a replica and we’re good to go. If you use MongoDB—download MongoDB Connector for BI and create a replica.
If you don’t have any data for the dashboard, you can use a publicly available cloud-based Postgres dataset with e-commerce data.
First, make sure you have Docker installed on your machine. You can also get started using Node.js.
Second, create new a folder for your Cube app and navigate to it:
Then, create a new docker-compose.yml file with Cube configuration. We'll use environment variables for configuration and instruct Cube to connect to a publicly available cloud-based Postgres dataset:
The last step is to run Cube.js:
Cube.js Data Schema
The next step is to create a Cube.js data schema. Cube.js uses the data schema to generate an SQL code, which will be executed in your database. The data schema is not a replacement for SQL. It is designed to make SQL reusable and give it a structure while preserving all of its power. Basic elements of the data schema are measures and dimensions.
Measure is referred to as quantitative data, such as the number of units sold, number of unique visits, profit, and so on.
Dimension is referred to as categorical data, such as state, gender, product name, or units of time (e.g., day, week, month).
Conventionally, schema files are located in the schema folder. Here is an example of the schema, which can be used to describe users’ data.
Now, with the above schema in place, we can send queries to the Cube.js API about users’ data. Cube.js queries are plain javascript objects. Usually it has one or more measures, dimensions, and timeDimensions.
If we want to answer the question “Where are our users based?” we can send the following query to the Cube.js:
Cube.js will generate the required SQL based on the schema, execute it, and send the result back.
Let’s create a slightly more complicated query. We can add a timeDimensions to see how the ratio of different cities has been changing every month during the last year. To do this, we will add a signedUp time dimension, group it by monthly, and filter only last year’s signups.
Cube.js can generate simple schemas based on your database’s tables.
To do that, you can open localhost:4000 in your browser. You will see Developer Playground, a companion tool that will help you develop your Cube.js app.
Please navigate to the Schema tab, select the public schema, and click "Generate Schema". Great! You can inspect generated schemas and send test queries on the Build tab of Developer Playground.

Frontend
We’ll build our frontend and dashboard with React, using the Cube.js React client. But you can use any framework or just vanilla JavaScript to build a frontend with Cube.js. This tutorial shows you how to build a dashboard in pure JavaScript.
We’ll set everything up using Create React App, which is officially supported by the React team. It packages all the dependencies for React app and makes it easy to get started with a new project. Run the following commands in your terminal:
Before we start the app, we'll need to create the .env file and put the credentials there, so the app will be able to connect to the Cube.js API:
Now we can start the app:
The last line starts a server on port 3000 and opens your web browser at localhost:3000.
We’ll build our UI with Reactstrap, which is a React wrapper for Bootstrap 4. Install Reactstrap and Bootstrap from NPM. Reactstrap does not include Bootstrap CSS, so this needs to be installed separately:
Import Bootstrap CSS in the src/index.js file before importing ./index.css:
Now we are ready to use the Reactstrap components.
The next step is to install Cube.js client to fetch the data from the server and our visualization library to display it. For this tutorial, we’re going to use Recharts. Cube.js is visualization agnostic, meaning you can use any library you want. We’ll also use moment and numeral to nicely format dates and numbers.
Finally, we’re done with dependencies, so let’s go ahead and create our first chart.
Replace the contents of src/App.js with the following:
You can check out this example in the CodeSandbox below.
Let’s look deeper at how we load data and draw the chart.
First, we’re initializing the Cube.js API client:
As you know, we've created the .env file with the credentials. In the development mode, Cube.js doesn't enforce the use of the token to authorize queries, so you can use any string for your token in REACT_APP_CUBEJS_TOKEN. You can learn more about using and generating tokens in the production environment in the docs.
Next, we are using the QueryRenderer Cube.js React component to load Orders data.
QueryRenderer performs an API request to the Cube.js API and uses the render props technique to let you render the result however you want to. We’ve already covered the query format above, but in case you want to refresh—here is the query format full reference.
The render parameter of QueryRenderer is a function of the type ({error, resultSet, isLoading}) => React.Node. The output of this function will be rendered by the QueryRenderer. A resultSet is an object containing data obtained from the query. If this object is not defined, it means that the data is still being fetched.
resultSet provides multiple methods for data manipulation, but in our case, we need just the chartPivot method, which returns data in a format expected by Recharts.
We’ll plot the Orders data as a bar chart inside a responsive container.
Building a Dashboard
We learned how to build a single chart with Cube.js and Recharts, and we are now ready to start building the whole dashboard. There are some best practices regarding designing the layout of the dashboard. The common practice is to put the most important and high-level metrics on the top as single value charts, sometimes called KPIs, and then list the relevant breakdowns of those metrics.
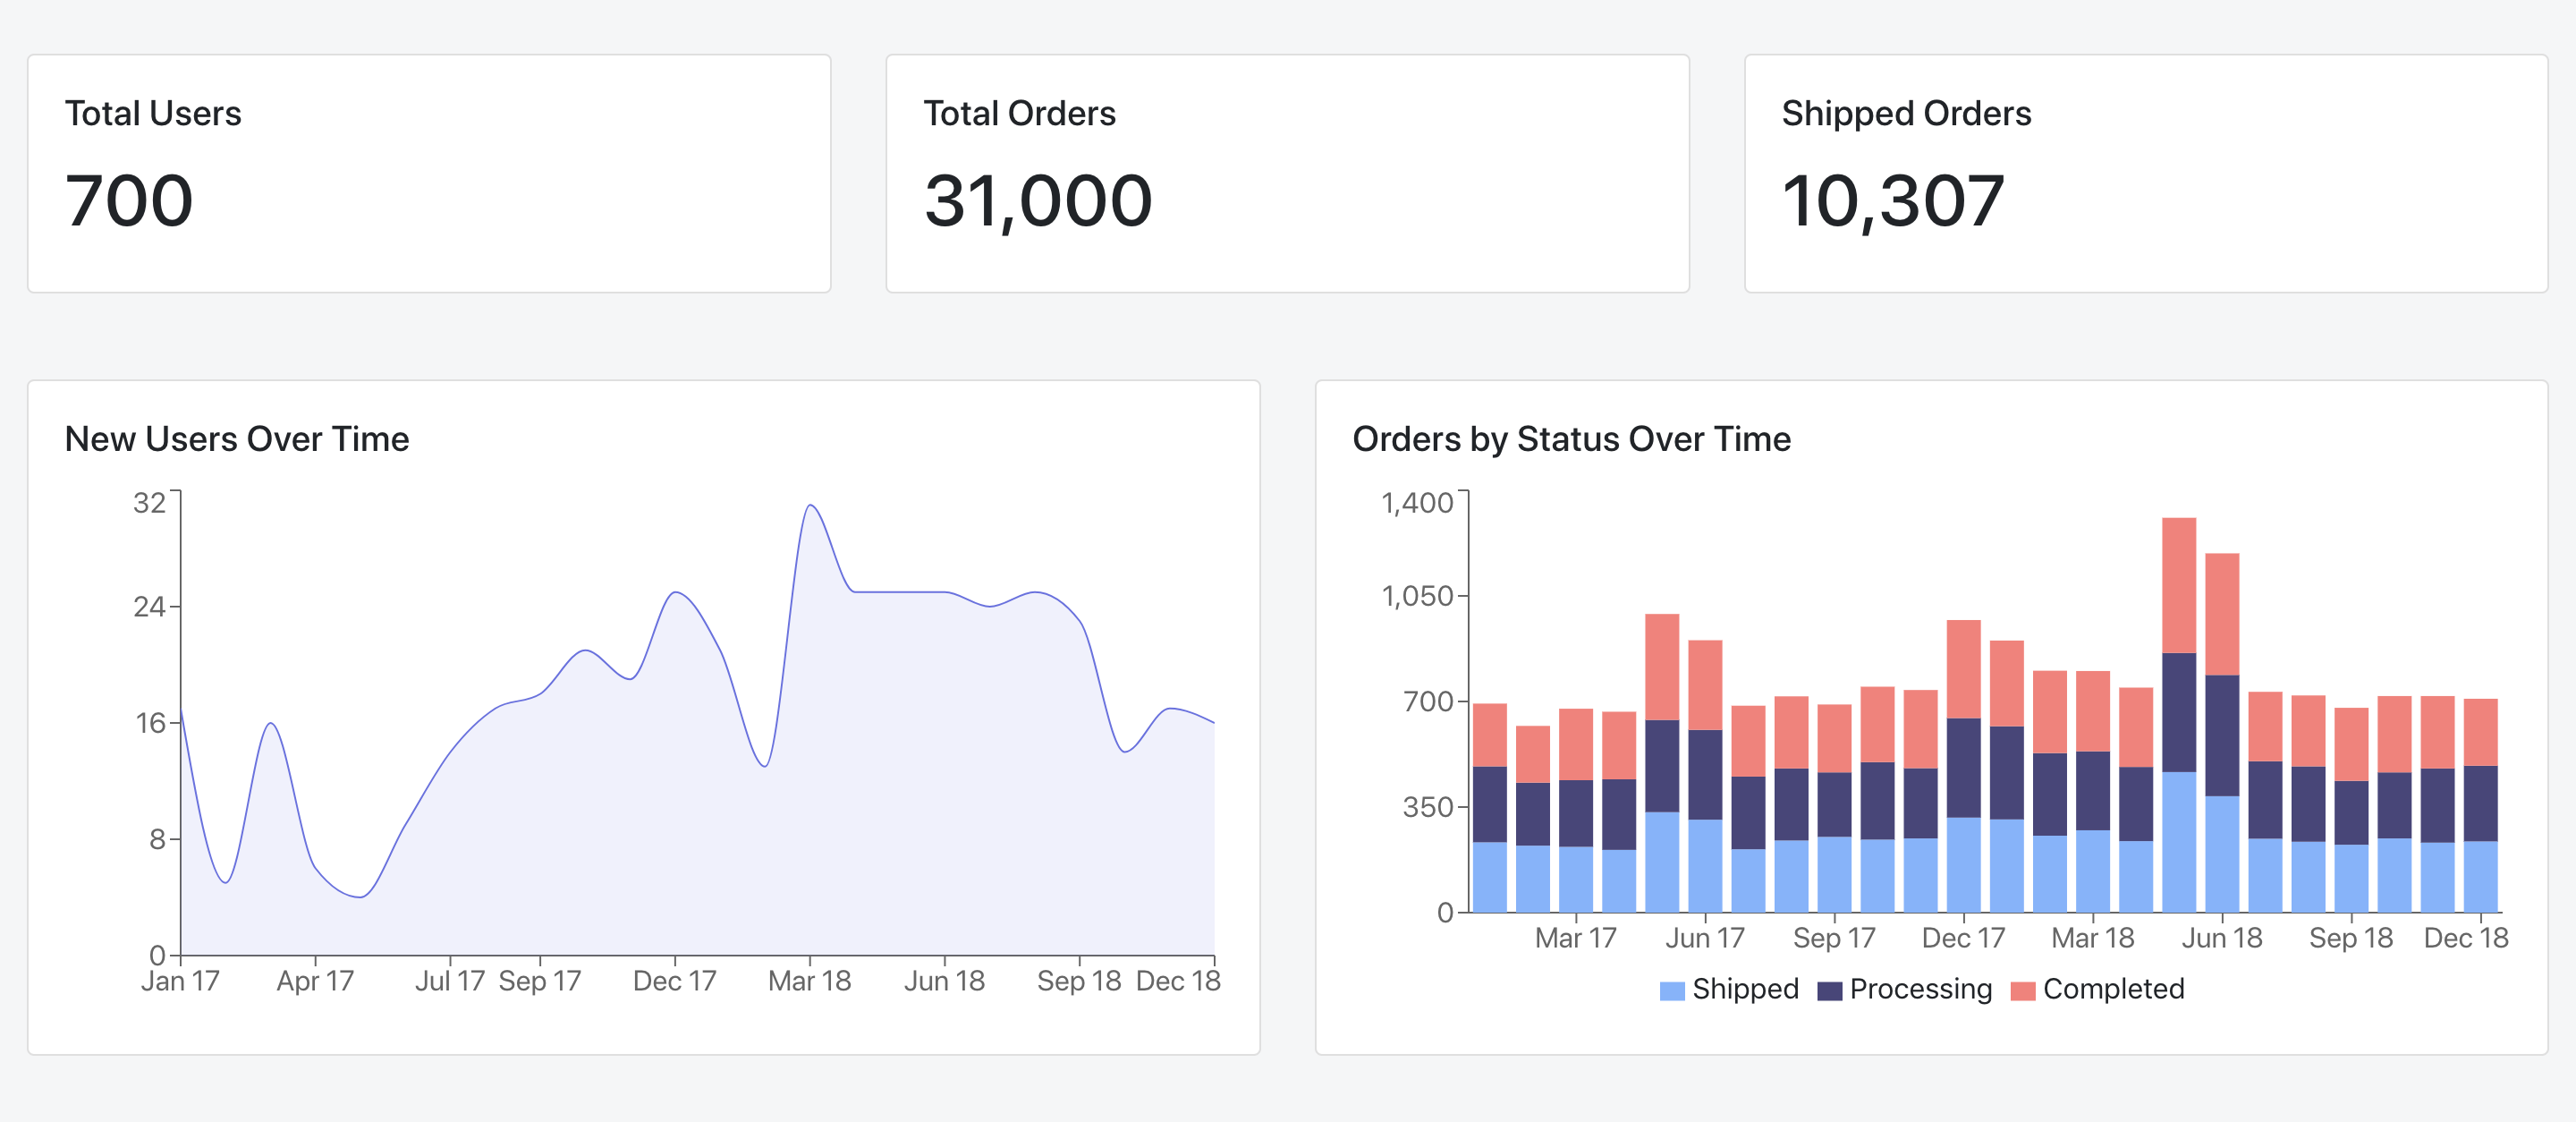
Here is the screenshot of our final dashboard with KPIs on top followed by bar and line charts.
First, let’s refactor our chart and extract the common code into a reusable <Chart /> component. Create an src/Chart.js file the following content:
Next, let’s use this component to create the dashboard. Replace the content of src/App.js with the following:
That is enough to build our first dashboard. Give it a try in the CodeSanbox below.
Next Steps
We’ve built a simple proof of concept dashboard with Cube.js. You can check the live demo here. The full source code is available on GitHub.
To learn more about Cube.js API deployment, you can refer to the deployment documentation.
And join our Slack! It is a great place to get help and stay up to date with new releases.