We're kicking off 2026 with major improvements to dashboard filters, a new exploration mode, and AI-assisted data modeling that gets you from connection to first model in minutes instead of hours.
AI-Assisted Onboarding
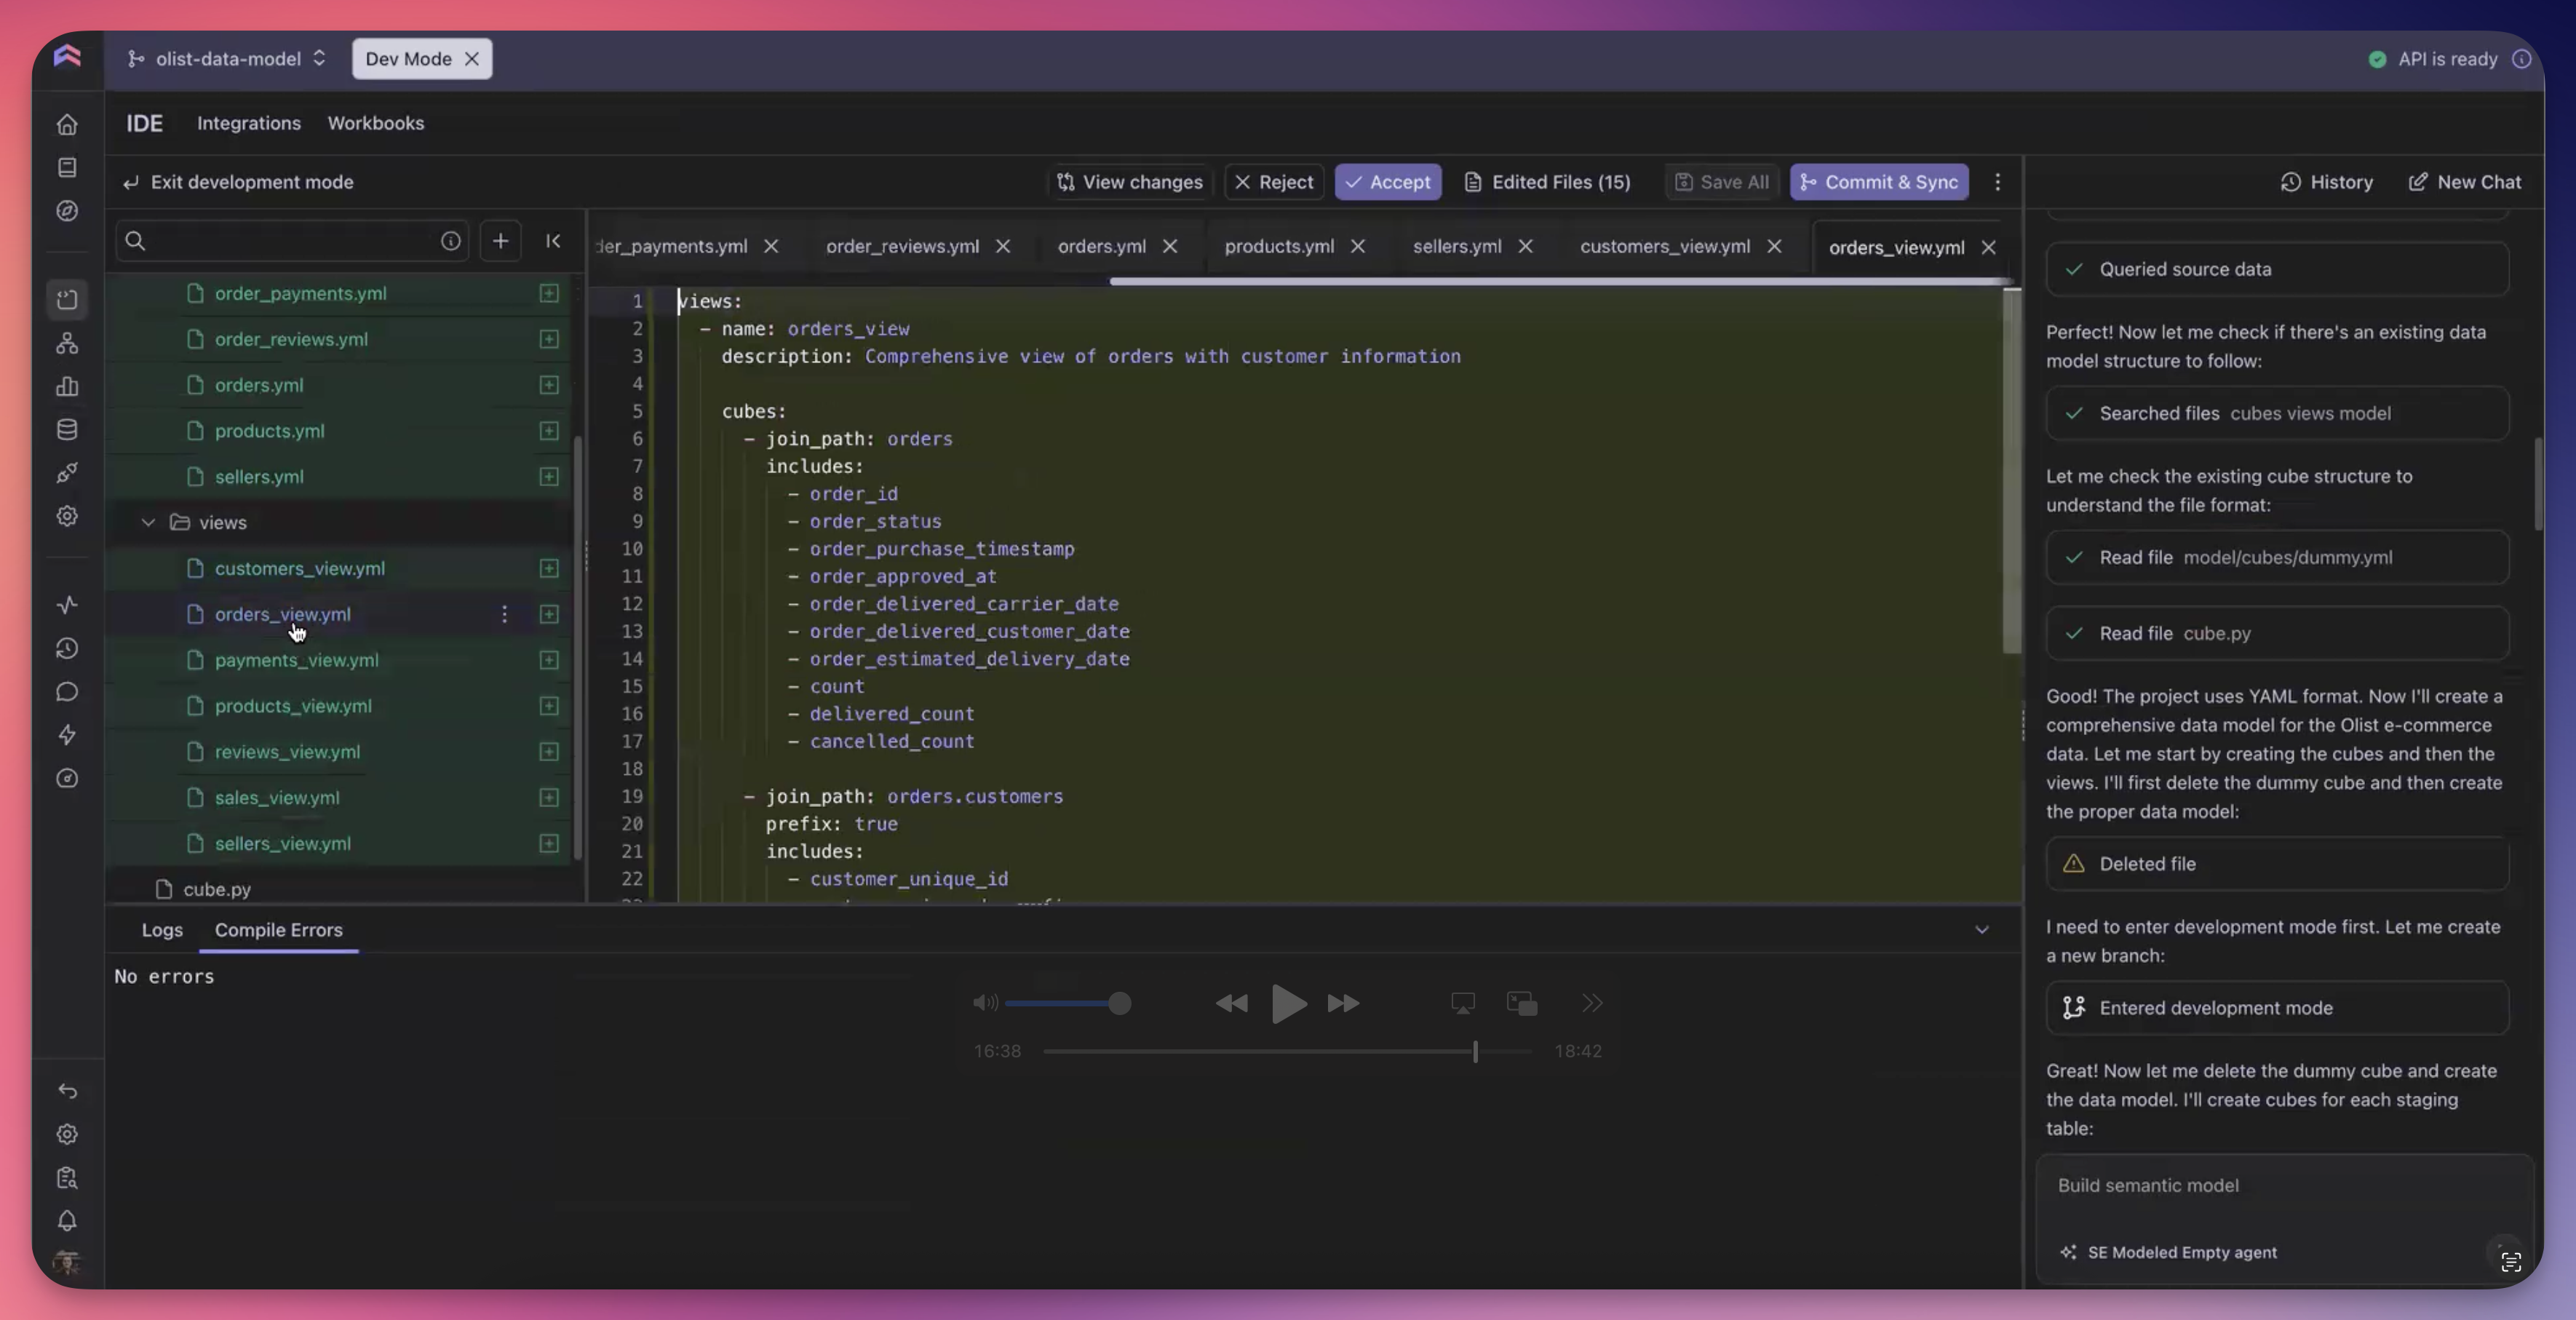
Getting started with Cube is now dramatically faster. The agent does the initial setup. You review, refine, and extend from there.
Connect your data warehouse and the Cube Agent analyzes your schema to automatically generate a starter semantic model with:
- Dimension and measure definitions
- Relationships between tables
- Cleaned-up naming conventions
- Common metric calculations
Once your model is set up, you can continue working with the Cube Semantic Model Agent to make changes conversationally ("add a new metric for average order price") rather than writing YAML directly.
Before finalizing the model, the agent verifies the updated definitions by querying the updated semantic model. You can then review a concise summary of these changes and test them within a workbook or the playground. You can always verify the logic being built by checking the semantic SQL.
Stateless Exploration
New "Explore" button in dashboards and the Analytics Chat opens any report in a modal window where you can:
- Ask follow-up questions in natural language
- Modify the visualization
- Customize the chart
- Save it as a new report if you find something useful
The exploration is stateless – experiment freely without cluttering your dashboards.
Learn more about exploration →
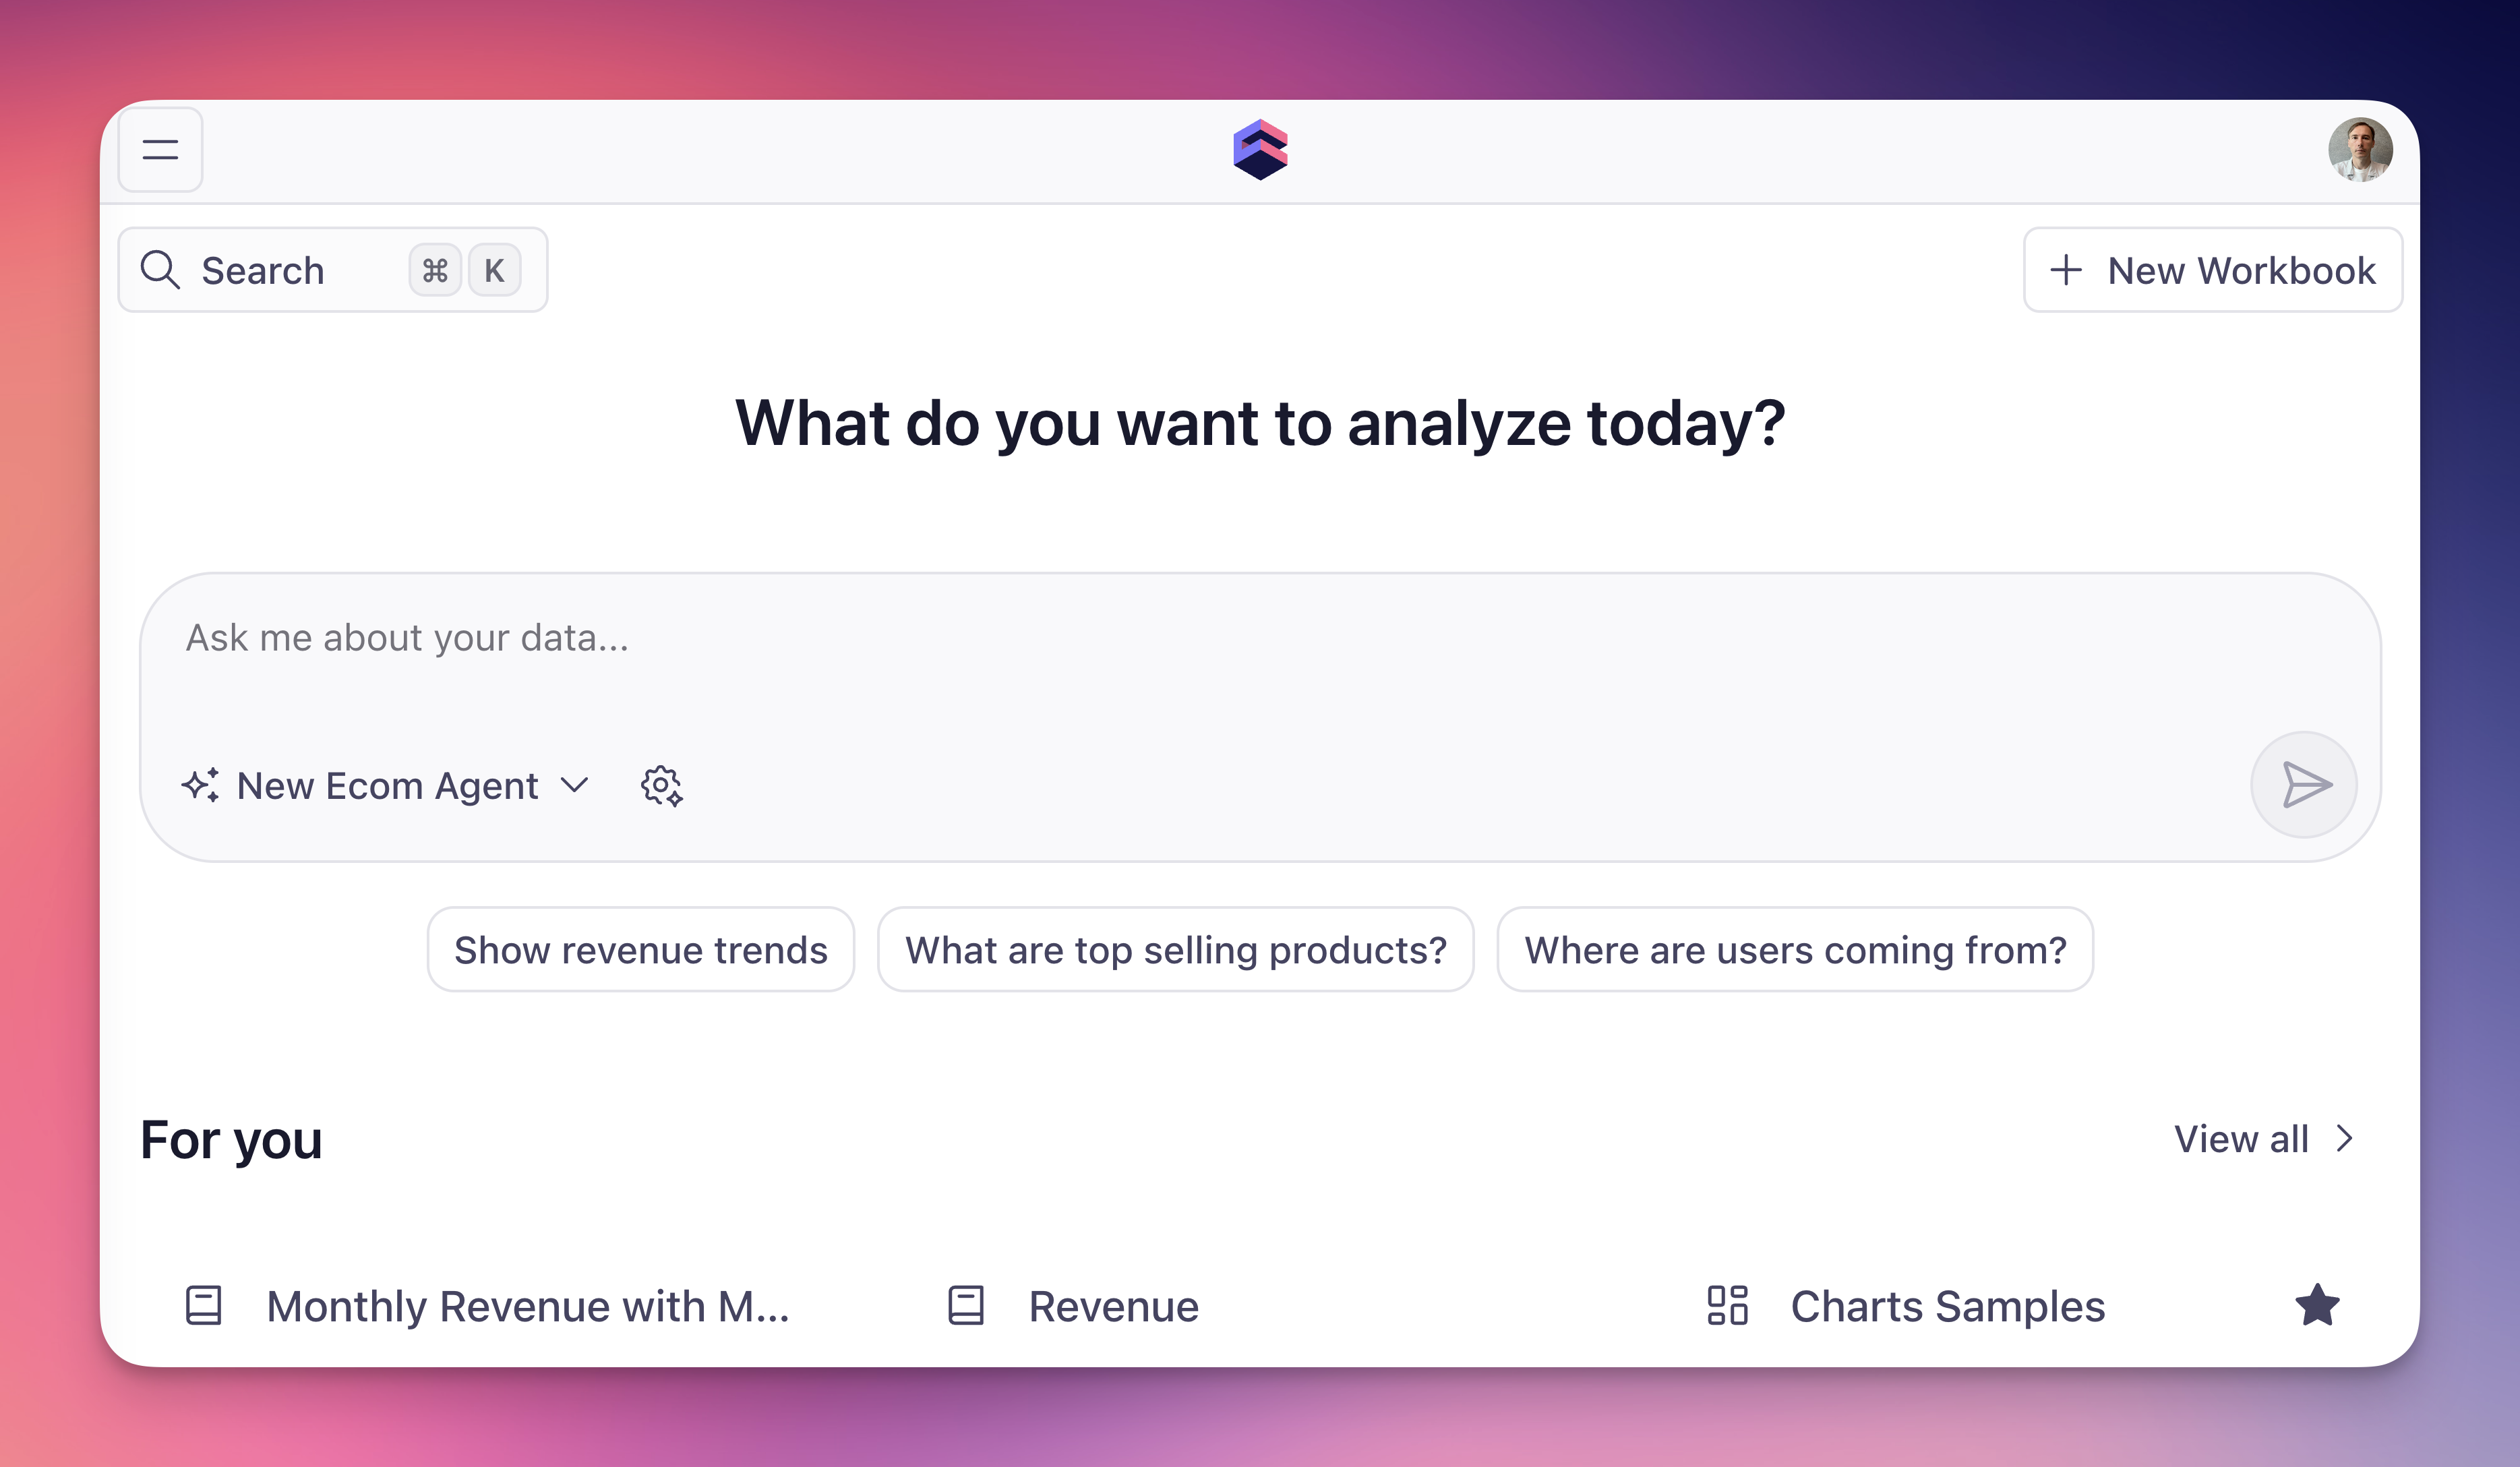
Prompt Suggestions
Admins can now create a list of suggested prompts for each agent. These show up in Analytics Chat to help users discover what's possible with their data model. Useful for onboarding new team members or highlighting common analyses.
Other Improvements
- Undo and redo in Workbooks and Explore: now you can press cmd + z to undo or changes or press cmd + shift + z to redo your changes.
- Custom filter dimension mapping: Override automatic matching and choose specific dimensions for each widget
- Granular widget control: Enable or disable filter application on individual report widgets
- Faceted filters: limit filter suggestions based on the values selected in other active filters.
- Row totals in pivot tables: Pivot tables in both Result and Chart support row totals now.
- Single value in dashboard filters: You can now configure dashboard filter to accept only single value instead of multiple values.
What's Next
These features are available now in Cube’s agentic analytics platform, and you can sign up for free.