Today, Cube powers analytics features inside thousands of applications where developers have leveraged Cube’s data schema as a metrics layer—a consistent, single source of truth. By powering a single repository of metrics, Cube helps developers quickly and reliably ship embedded analytics features and other data-powered applications with the peace of mind that their metrics definitions remain consistent.
Cube solves this problem very well for application developers, but it’s been unsolved for users of dashboards and business intelligence tools, and the data engineering teams that support them.
In most modern organizations, there are multiple tools that consume data from the same single warehouse but perform their own downstream metrics calculations. This leads to inconsistent calculations and disagreements between teams: How do we calculate revenue? Does it include revenue from X cohort? How do monthly payments affect annual projections?
The more tools an organization uses, the more inconsistencies and conflicts arise, and the harder it is for a business to make decisions using accurate data. To avoid this, they need a centralized, upstream location in which to build and maintain their metrics, so that every tool works from the same source of metric truth.
Today, I’m excited to share a way for Cube to function as a metrics store for any data consumer: we’re proud to announce the new Cube SQL API. With the addition of this API, Cube now functions as a headless BI layer to provide consistent metrics to any querying and visualization tool.

How it works
In the modern data stack, Cube acts as a proxy for data warehouses and translates every incoming query, whether it is JSON, GraphQL, or SQL, into native queries to the underlying data storage.

Cube translates queries by using a JSON-based data modeling layer consisting of cubes. Think of these as database views, backed by either a reference to an existing database table or a new table created by SELECT statement. Cubes contain defined measures and dimensions.
Measures are quantitative data, such as the number of units sold, unique visits, profit, and so forth. Dimensions are categorical data, such as state, gender, product name, or units of time. (You can learn more about Cube’s data schema in the docs.)
Below is an example of the cube we can use to describe metrics about leads for a sales organization.
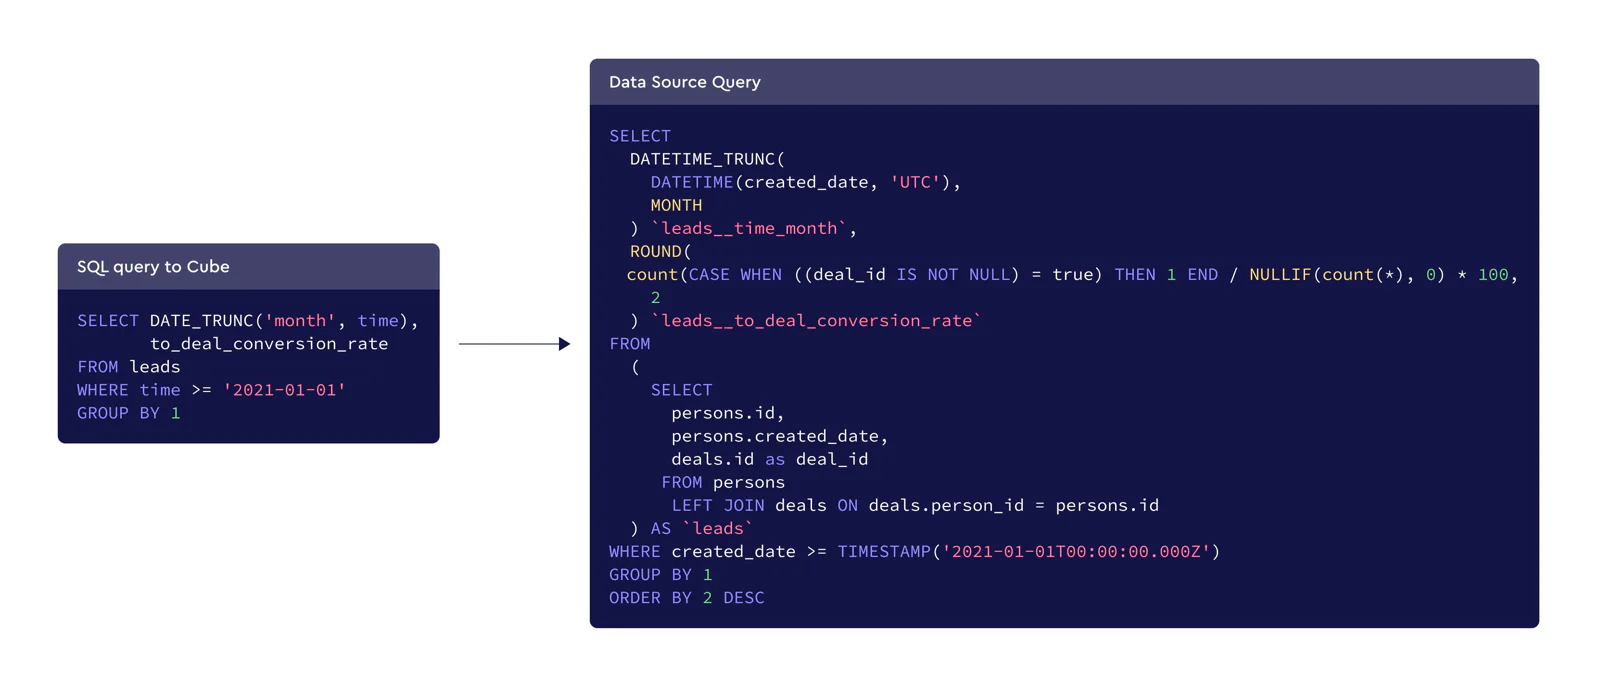
With the above definitions of our metrics we can ask questions like "What is our monthly lead-to-deal conversion rate over the last year?"
When we query Cube’s metrics layer via the SQL API, cubes will be presented as tables and measures and dimensions as columns. To answer the above question with SQL we need to write the following query:
Cube will translate this query into the query for the underlying database.
You can query Cube with SQL from your favorite programming language, such as Python.

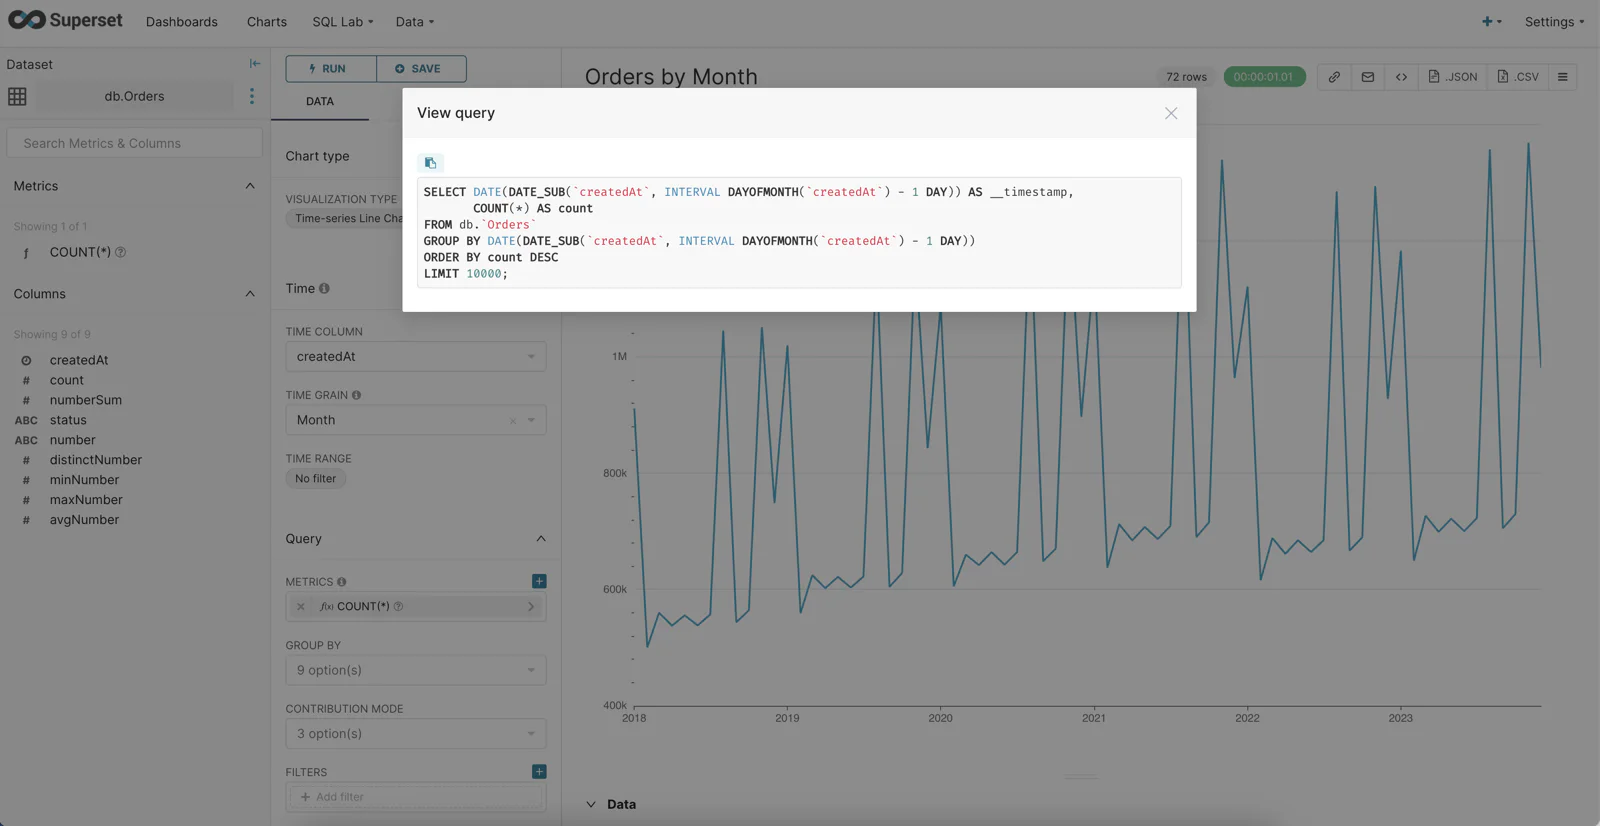
Most powerfully, because the Cube SQL API speaks MySQL-compatible SQL, you also can connect your favorite BI tool—like Superset, Metabase, or Tableau—directly to Cube, and let Cube generate SQL to fetch and display data. Here’s an example of using Superset with the Cube SQL API.

You can check our documentation for the full Superset integration tutorial.
Built-in relational cache
Every query can leverage Cube’s pre-aggregations layer—a database-agnostic materialization engine—in order to make dashboards and reports load in milliseconds instead of minutes.
While defining metrics, developers can specify which metrics they want to pre-aggregate. Cube will run complex calculations beforehand in the background and will create a cache table with the results. All queries will be served from this cache table, dramatically increasing dashboards’ performance.
Where we go next
We’re excited about today’s launch, but it is only the beginning of the journey! We’re committed to supporting all the major SQL operations, and improving error handling to provide more useful tips to users. Please let us know in our Slack channel if you see something that is not working as you expected.
Everything described here is available in Cube’s OSS offering, licensed under Apache 2.0. In addition, we're working on cataloguing and collaboration tools for the Cube metrics layer in Cube Cloud, our fully-managed Cube service. Watch this space.
If you’re interested in learning more, please give us a try.
